NCERT Exemplar Solutions: Statistics | Mathematics (Maths) Class 9 PDF Download
| Table of contents |
|
| Exercise 14.1 |
|
| Exercise 14.2 |
|
| Exercise 14.3 |
|
| Exercise 14.4 |
|
Exercise 14.1
Q.1. The class mark of the class 90-120 is :
(a) 90
(b) 105
(c) 115
(d) 120
Correct Answer is Option (b)
Class mark is the mean of the upper and lower limit of the class interval = (90 + 120)/2 = 105
Q.2. The range of the data :
25, 18, 20, 22, 16, 6, 17, 15, 12, 30, 32, 10, 19, 8, 11, 20 is
(a) 10
(b) 15
(c) 18
(d) 26
Correct Answer is Option (d)
The range of the data=Highest vale-lowest value
Highest value= 32
Lowest value = 6
∴ Range of the data = 32 − 6 = 26
Q.3. In a frequency distribution, the mid value of a class is 10 and the width of the class is 6. The lower limit of the class is :
(a) 6
(b) 7
(c) 8
(d) 12
Correct Answer is Option (b)
The mid value of the class = 10
Width of the interval = 6
then lower limit = Mid value − (Width/2) = 10 - 3 = 7
Q.4. The width of each of five continuous classes in a frequency distribution is 5 and the lower class-limit of the lowest class is 10. The upper class-limit of the highest class is:
(a) 15
(b) 25
(c) 35
(d) 40
Correct Answer is Option (c)
Lower class limit = 10
Width of each class = 5
Width till the upper class limit for a frequency distribution having 5 classes = 5 × 5 = 25
Hence, the upper class limit of highest class = 10 + 25 = 35
Q.5. Let m be the mid-point and l be the upper class limit of a class in a continuous frequency distribution. The lower class limit of the class is :
(a) 2m + l
(b) 2m – l
(c) m – l
(d) m – 2l
Correct Answer is Option (b)
Let a be lower class limit, l is the upper class limit and m is the mid-point then, mid-point m = (a + l)/2
Therefore, a = 2m − l
Q.6. The class marks of a frequency distribution are given as follows :
15, 20, 25, ...
The class corresponding to the class mark 20 is :
(a) 12.5 – 17.5
(b) 17.5 – 22.5
(c) 18.5 – 21.5
(d) 19.5 – 20.5
Correct Answer is Option (b)
Width = 5
Class marks = 20
∴ Lower limit = 20 - (5/2)
Upper limit = 20 + (5/2)
Hence the class corresponding to the class mark 20 is 17.5 − 22.5.
Q.7. In the class intervals 10-20, 20-30, the number 20 is included in :
(a) 10-20
(b) 20-30
(c) both the intervals
(d) none of these intervals
Correct Answer is Option (b)
The number is always included in the lower limit of the class interval. Hence, 20 is included in 20−30.
Q.8. A grouped frequency table with class intervals of equal sizes using 250-270 (270 not included in this interval) as one of the class interval is constructed for the following data :
268, 220, 368, 258, 242, 310, 272, 342,
310, 290, 300, 320, 319, 304, 402, 318,
406, 292, 354, 278, 210, 240, 330, 316,
406, 215, 258, 236.
The frequency of the class 310-330 is:
(a) 4
(b) 5
(c) 6
(d) 7
Correct Answer is Option (c)
Arranging the following data in a table, we get,
Therefore, we get from the above table,
The frequency of the class 310-330 is = 6
Hence, option (C) is the correct answer.

Q.9. A grouped frequency distribution table with classes of equal sizes using 63-72 (72 included) as one of the class is constructed for the following data :
30, 32, 45, 54, 74, 78, 108, 112, 66, 76, 88,
40, 14, 20, 15, 35, 44, 66, 75, 84, 95, 96,
102, 110, 88, 74, 112, 14, 34, 44.
The number of classes in the distribution will be :
(a) 9
(b) 10
(c) 11
(d) 12
Correct Answer is Option (b)
Let us arrange the data given in groups like 13-22, 23-32 …. 103-112
Class width will be 9
Let us arrange it in tabular form
Therefore, the number of classes in the distribution will be 10.

Q.10. To draw a histogram to represent the following frequency distribution :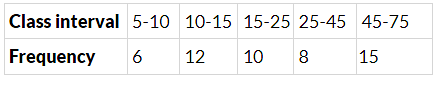
the adjusted frequency for the class 25-45 is :
(a) 6
(b) 5
(c) 3
(d) 2
Correct Answer is Option (d)
The frequency distribution will consist of classes with an interval of 5. The class 25−45 includes four such classes with an interval of 5. Thus the adjusted frequency will be (8/4) = 2.
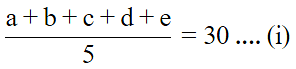
Q.11. The mean of five numbers is 30. If one number is excluded, their mean becomes 28. The excluded number is :
(a) 28
(b) 30
(c) 35
(d) 38
Correct Answer is Option (d)
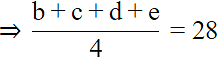
Let the five numbers be a, b, c, d, e
Then,
Let the number excluded be a
⇒ b + c + d + e = 112
⇒ a + 112 = 150 ... From (i)
⇒ a = 38.
Q.12. If the mean of the observations :
x, x + 3, x + 5, x + 7, x + 10 is 9, the mean of the last three observations is
(a) 10(1/3)
(b) 10(2/3)
(c) 11(1/3)
(d) 11(2/3)
Correct Answer is Option (c)
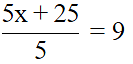
Mean of x, x+3, x+5, x+7, x+10 = 9
Sum of the terms = 5x + 25
Mean =
x + 5 = 9
x = 4
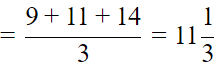
Last three observations are 9, 11, 14
Mean
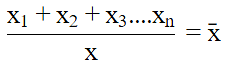
Q.13. If  represents the mean of n observations x1, x2, ..., xn, then value of
 is:
is:
(a) -1
(b) 0
(c) 1
(d) n - 1
Correct Answer is Option (b)
is the average of all the observations. If we draw all the numbers and the mean on a number line, then half of the numbers will lie on the right side of the mean and other half on the left side. Hence, (xi −
 is the average of all the observations. If we draw all the numbers and the mean on a number line, then half of the numbers will lie on the right side of the mean and other half on the left side. Hence, (xi −
  ) will give equal number of positive and negative terms whose sum will be 0.
Q.14. If each observation of the data is increased by 5, then their mean
(a) remains the same
(b) becomes 5 times the original mean
(c) is decreased by 5
(d) is increased by 5
Correct Answer is Option (d)
Let there be n terms.
Increasing every term by 5 will increase their sum by 5n.
Increase in Mean = (5n/n) = 5
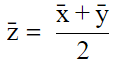
Q.15. Let  be the mean of x1, x2, ... , xn and
  the mean of y1, y2, ... , yn. If
  is the mean of x1, x2, ... , xn, y1, y2, ... , yn, then
  is equal to
(a) 
(b) 
(c) 
(d) 
Correct Answer is Option (b)
 is the mean of x1, x2, ... , xn, then
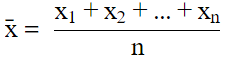
 is the mean of y1, y2, ... , yn. then
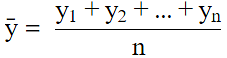
 is the mean of x1, x2, ... , xn, y1, y2, ... , yn,
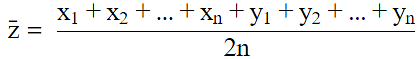
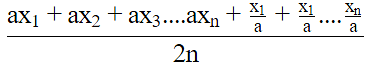
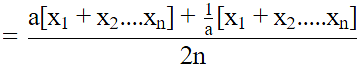
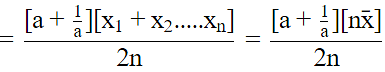
Q.16. If  is the mean of x1, x2, ... , xn, then for a ≠ 0, the mean of ax1, ax2, ... , axn, x1/a,
 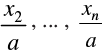 is
is
(a) 
(b) 
(c) 
(d) 
Correct Answer is Option (b)
Thus,

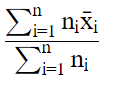
Q.17. If  are the means of n groups with n1, n2, ... , nn number of observations respectively, then the mean
  of all the groups taken together is given by:
(a) 
(b) 
(c) 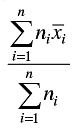
(d) 
Correct Answer is Option (c)
Mean of all the groups taken together = (Total Sum/Total Count)
Mean =
Q.18. The mean of 100 observations is 50. If one of the observations which was 50 is replaced by 150, the resulting mean will be :
(a) 50.5
(b) 51
(c) 51.5
(d) 52
Correct Answer is Option (b)
Mean of 100 observation = 50
∴ Total of 100 observation = 100 × 50 = 5000
If one of the observation 50 is replaced by 150 than total of new observation is = 5000 − 50 + 150 = 5100
Hence the mean of new 100 observation = 5100/100 = 51
Q.19. There are 50 numbers. Each number is subtracted from 53 and the mean of the numbers so obtained is found to be –3.5. The mean of the given numbers is :
(a) 46.5
(b) 49.5
(c) 53.5
(d) 56.5
Correct Answer is Option (d)
It is given that
n = 50
By subtracting 53 from each observation, we get x̄new
x̄new = [(-x1 + 53) + (-x2 + 53) + …. + (-x50 + 53)]/50
Substituting the values
-3.5 = [-(x1 + x2 + ….. + x50) + (53 + 53 + ….. + 50 times)]/50
By cross multiplication
-3.5 × 50 = -(x1 + x2 + ….. + x50) + 53 × 50
So we get
∑50i=1xi = 2650 + 175 = 2825
We know that
Mean of 50 observations = 1/50 ∑50i=1xi
Substituting the value
= 1/50 × 2825
= 56.5
Therefore, the mean of the given numbers is 56.5.

Q.20. The mean of 25 observations is 36. Out of these observations if the mean of first 13 observations is 32 and that of the last 13 observations is 40, the 13th observation is :
(a) 23
(b) 36
(c) 38
(d) 40
Correct Answer is Option (b)
Mean of 25 observations = 36
Sum of 25 observations = 36 × 25 = 900
Mean of first 13 observations = 32
Sum of first 13 observations = 32 × 13 = 416
Mean of Last 13 observation = 40
Sum of Last 13 observations = 40 × 13 = 520
Sum of first 13 observation + Sum of last 13 obs − 13th observation = Total sum of 25 observations
416+520−13th observation = 900
13th observation = 36
Q.21. The median of the data
78, 56, 22, 34, 45, 54, 39, 68, 54, 84 is
(a) 45
(b) 49.5
(c) 54
(d) 56
Correct Answer is Option (c)
Terms are: 78, 56, 22, 34, 45, 54, 39, 68, 54, 84.
Arranging the terms in ascending order: 22, 34, 39, 45, 54, 54, 56, 68, 78, 84.Since the number of terms are even, the median will be the mean of 5th and 6th terms:
Median = (54 + 54)/2 = 54
Q.22. For drawing a frequency polygon of a continous frequency distribution, we plot the points whose ordinates are the frequencies of the respective classes and abcissae are respectively :
(a) upper limits of the classes
(b) lower limits of the classes
(c) class marks of the classes
(d) upper limits of perceding classes
Correct Answer is Option (c)
For drawing a frequency polygon of a continuous frequency distribution, we draw the class marks of the classes on the abscissae and the frequency of the classes on the ordinates.
We know, class marks are the mean of lower and upper limit of the class intervals.
Hence, option (c) is correct.
Q.23. Median of the following numbers : 4, 4, 5, 7, 6, 7, 7, 12, 3 is
(a) 4
(b) 5
(c) 6
(d) 7
Correct Answer is Option (c)
Terms are: 4, 4, 5, 7, 6, 7, 7, 12, 3.
Arranging the terms in ascending order: 3, 4, 4, 5, 6, 7, 7, 7, 12.
Since the number of terms is odd the median will be the middle term i.e. 5th term which is 6.
Q.24. Mode of the data 15, 14, 19, 20, 14, 15, 16, 14, 15, 18, 14, 19, 15, 17, 15 is
(a) 14
(b) 15
(c) 16
(d) 17
Correct Answer is Option (b)
Given Data:
15, 14, 19, 20, 14, 15, 16, 14, 15, 18, 14, 19, 15, 17, 15
Arranging it in ascending order: 14, 14, 14, 14, 15, 15, 15, 15, 15, 16, 17, 18, 19, 19, 20 15 occurs 5 times and most number of time.
Hence, it is the mode of the data.
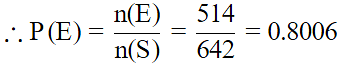
Q.25. In a sample study of 642 people, it was found that 514 people have a high school certificate. If a person is selected at random, the probability that the person has a high school certificate is :
(a) 0.5
(b) 0.6
(c) 0.7
(d) 0.8
Correct Answer is Option (d)
Given that:
Total number of people n(S) = 642
No. of peoples having high school certificate n(E) = 514
P(E) = Probability that the person has a school certificate
Hence, (d) is the correct option.
Q.26. In a survey of 364 children aged 19-36 months, it was found that 91 liked to eat potato chips. If a child is selected at random, the probability that he/she does not like to eat potato chips is :
(a) 0.25
(b) 0.50
(c) 0.75
(d) 0.80
Correct Answer is Option (c)
Favorable cases = 364 − 91 = 273
Total cases = 364
∴ Probability = 273/364 = 0.75
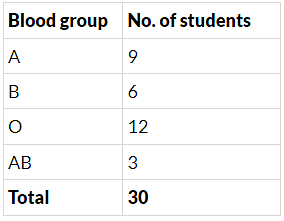
Q.27. In a medical examination of students of a class, the following blood groups are recorded: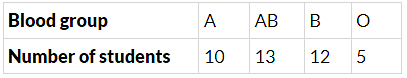
A student is selected at random from the class. The probability that he/she has blood group B, is :
(a) 1/4
(b) 13/40
(c) 3/10
(d) 1/8
Correct Answer is Option (c)
prob (B blood group) = 12/40 = 3/10
Q.28. Two coins are tossed 1000 times and the outcomes are recorded as below :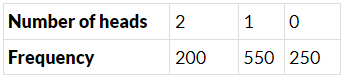
Based on this information, the probability for at most one head is
(a) 1/5
(b) 1/4
(c) 4/5
(d) 3/4
Correct Answer is Option (c)
Total number of outcomes = 1000
Number of favourable outcomes = 800
Probability = 800/1000 = 4/5
Q.29. 80 bulbs are selected at random from a lot and their life time (in hrs) is recorded in the form of a frequency table given below :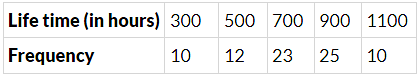
One bulb is selected at random from the lot. The probability that its life is 1150 hours, is
(a) 1/80
(b) 7/16
(c) 0
(d) 1
Correct Answer is Option (c)
Number of bulbs in the lot, n(S) = 80
Number of bulbs whose lifetime is 1150 hours, n(E) = 0
∴ Probability that its lifetime is 1150 hours = n(E)/n(S) = 0.
Hence, the probability that its lifetime is 1150 hours is 0.
Q.30. The probability that bulbs selected randomly from the lot has life less than 900 hours is:
(a) 11/40
(b) 5/16
(c) 7/16
(d) 9/16
Correct Answer is Option (d)
Total favourable cases = 10 + 12 + 23 = 45
∴ P(event) = 45/80 = 9/16.
Exercise 14.2
Q.1. The frequency distribution :
has been represented graphically as follows :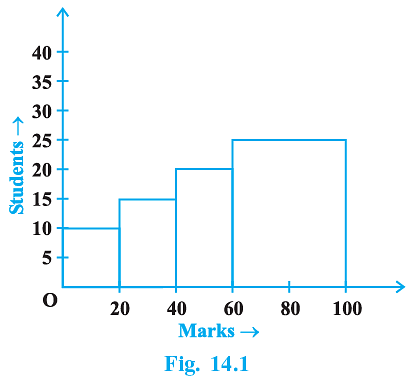
Do you think this representation is correct? Why?
No, here the widths of the rectangles are varying, so we need to make certain modifications in the length of the rectangles so that the areas are proportional to the frequencies. We proceed as follows:
(i) Select a class interval with the minimum class size, here the minimum class size is 20.
(ii) The length of the rectangles are then modified to be proportionate to the class size 20.
Now, we get the following modified table
So, the correct histogram with varying width is given below


Q.2. In a diagnostic test in mathematics given to students, the following marks (out of 100) are recorded :
46, 52, 48, 11, 41, 62, 54, 53, 96, 40, 98, 44
Which ‘average’ will be a good representative of the above data and why?Median will be a good representative of the data, because (i) each value occurs once, (ii) the data is influenced by extreme values. Hence, option B is the correct answer.
Q.3. A child says that the median of 3, 14, 18, 20, 5 is 18. What doesn’t the child understand about finding the median?
To calculate the median of any data series. The data series has to be arranged in the ascending order. The child hasn't arranged the data series in ascending order.
Q.4. A football player scored the following number of goals in the 10 matches :
1, 3, 2, 5, 8, 6, 1, 4, 7, 9
Since the number of matches is 10 (an even number), therefore, the median = 5th observation + 6th observation/2
= (8 + 6)/2 = 7
Is it the correct answer and why?
No, the obtained data solution in the question is not the correct answer, because the data has to be arranged in either ascending or descending order before finding the median. Now, arranging the data in ascending order, we get,
1,1,2,3,4,5,6,7,8,9Here, the number of observations is 10, which is even.

Q.5. Is it correct to say that in a histogram, the area of each rectangle is proportional to the class size of the corresponding class interval? If not, correct the statement.
No, this is not a correct statement.
In a histogram, horizontal axis represents the class intervals whose width is fixed & the varying data is plotted along the y-axis. So in all the rectangles of a histogram, width remains same & the length changes.
So correct statement is "In a histogram, the area of each rectangle is proportional to the frequency of its class."
Q.6. The class marks of a continuous distribution are :
1.04, 1.14, 1.24, 1.34, 1.44, 1.54 and 1.64
Is it correct to say that the last interval will be 1.55 - 1.73? Justify your answer.
Class mark means the mid point of a class interval.
Difference between two consecutive class marks is always equal to the class size.
Now 1.14 − 1.04 = 0.1
1.24 − 1.14 = 0.1
1.34 − 1.24 = 0.1 and so on
Class size = 0.1
But in class interval (1.55 − 1.73),1.73 − 1.55 = 0.8 which is not equal to the class size found previously.
So class interval (1.55 − 1.73) cannot be the correct class interval for the given class marks.
Q.7. 30 children were asked about the number of hours they watched TV programmes last week. The results are recorded as under :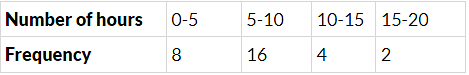
Can we say that the number of children who watched TV for 10 or more hours a week is 22? Justify your answer.
From the given table, number of children who watched tv more than 10 hours are number of children who watched within 10−15 and 15−20 hours.
Therefore, number of children who watched tv more than 10 hours = 4 + 2 = 6 hours.
Q.8. Can the experimental probability of an event be a negative number? If not, why?
No, the experimental probability of an event cannot be a negative number. This is because of the Number of outcomes favorable to an event (E)≤ Number of all possible outcomes.
So, 0 ≤ P(E) ≤ 1.
Q.9. Can the experimental probability of an event be greater than 1? Justify your answer.
The experimental probability of an event cannot be greater than 1 since the number of trials in which the event can happen cannot be greater than the total number of trials.
Q.10. As the number of tosses of a coin increases, the ratio of the number of heads to the total number of tosses will be (1/2). Is it correct? If not, write the correct one.
No. As the number of tosses of a coin increases, the ratio of the number of heads to the total number of tosses will be nearer to (1/2), not exactly (1/2).
Exercise 14.3
Q.1. The blood groups of 30 students are recorded as follows:
A, B, O, A, AB, O, A, O, B, A, O, B, A, AB, B, A, AB, B,
A, A, O, A, AB, B, A, O, B, A, B, A
Prepare a frequency distribution table for the data.
Number of students having blood group AB = 3
Total students = 30
P = (3/30) = (1/10)
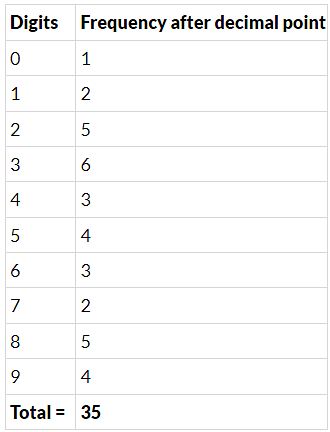
Q.2. The value of π upto 35 decimal places is given below:
3. 14159265358979323846264338327950288
Make a frequency distribution of the digits 0 to 9 after the decimal point.
Frequency Distribution Table for digits after decimal point in the value of π.
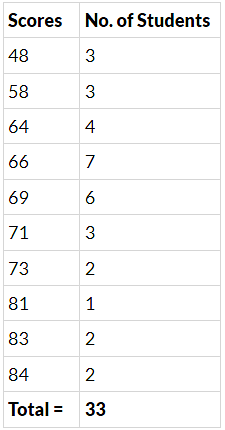
Q.3. The scores (out of 100) obtained by 33 students in a mathematics test are as follows:
69, 48, 84, 58, 48, 73, 83, 48, 66, 58, 84000
66, 64, 71, 64, 66, 69, 66, 83, 66, 69, 71
81, 71, 73, 69, 66, 66, 64, 58, 64, 69, 69
Represent this data in the form of a frequency distribution.
Arrange the given scores in ascending order:
48, 48, 48, 58, 58, 58, 64, 64, 64, 64, 66, 66, 66, 66, 66, 66, 66, 69, 69, 69, 69, 69, 69, 71, 71, 71, 73, 73, 81, 83, 83, 84, 84
Q.4. Prepare a continuous grouped frequency distribution from the following data: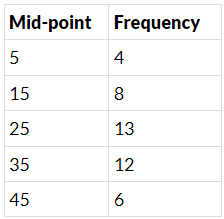
Also find the size of class intervals.
We know that , if m is the midpoint of a class and h is the class size, then lower limit of class interval = m − (h/2)
Upper limit of class interval = m + (h/2)
We have class six, 15 − 5 = 10
so the class interval formed from the midpoint 5 is
= (5 - (10/2)) - (5 + (10/2)) i.e 0−10
Containing in the same manner, the continuous classes formed are;
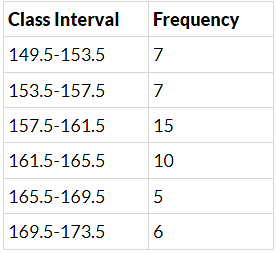
Q.5. Convert the given frequency distribution into a continuous grouped frequency distribution: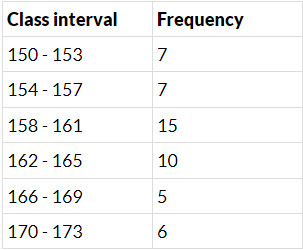
In which intervals would 153.5 and 157.5 be included?
To convert inclusive class interval into an exclusive class interval:
(1) Find the difference between the upper limit of the class interval and the lower limit of the next class interval.
For example, the upper limit of the class interval 150-153 is 153. The lower limit of the next class interval 154 - 157 is 154. The difference is 154 - 153 = 1
(2) Subtract half of the difference from the lower limit of the class interval and add half of that difference to the upper limit of a class interval.
Half of 1 is 0.5. Hence add 0.5 to the upper limit and subtract 0.5 from the lower limit for each class interval.
Thus, we get:-
153.5 is included in the class interval 153.5 - 157.5 and 157.5 is included in the class interval 157.5 - 161.5.
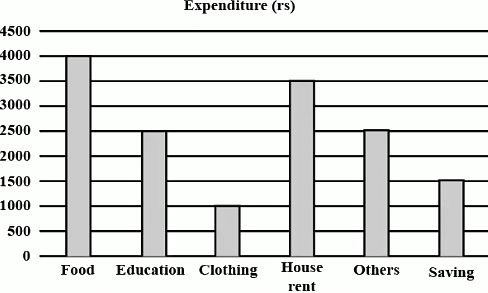
Q.6. The expenditure of a family on different heads in a month is given below: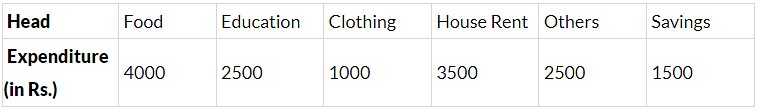
Draw a bar graph to represent the data above.
To represent the above data by a bar graph, we first draw a horizontal and a vertical line. Since six values of the numerical data are given. So, we mark six points on the horizontal line at equal distance and erect rectangle of the same width at these points. The heights of the rectangle are proportional to the numerical values of the data as shown in the figure given below.
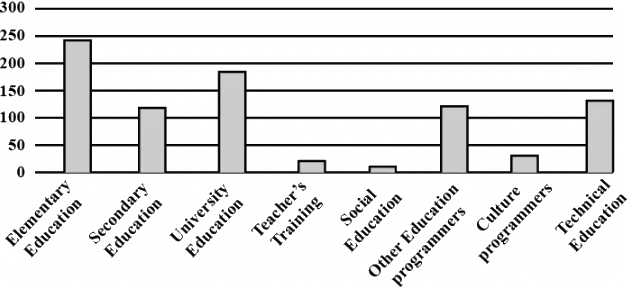
Q.7. Expenditure on Education of a country during a five year period (2002-2006), in crores of rupees, is given below:
Represent the information above by a bar graph.
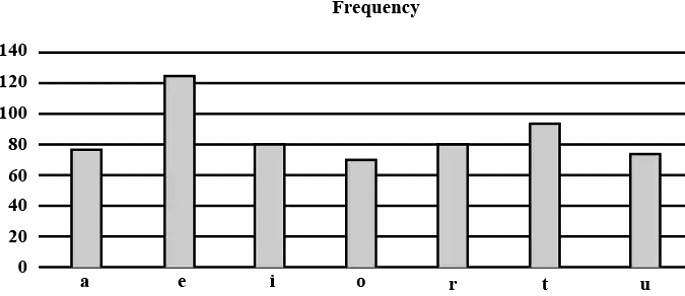
Q.8. The following table gives the frequencies of most commonly used letters a, e, i, o, r, t, u from a page of a book :
Represent the information above by a bar graph.
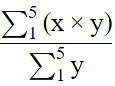
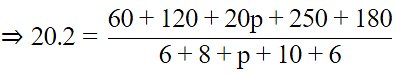
Q.9. If the mean of the following data is 20.2, find the value of p: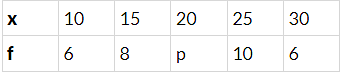
Mean
⇒ (30+p) × 20.2 = 20p + 610
⇒ 0.2p = 4
⇒ p = 20
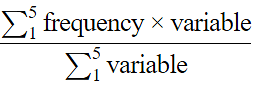
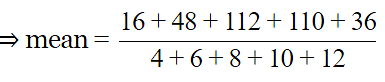
Q.10. Obtain the mean of the following distribution: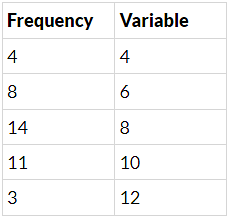
Mean =
⇒ mean = (322/40)
⇒ mean = 8.05
Q.11. A class consists of 50 students out of which 30 are girls. The mean of marks scored by girls in a test is 73 (out of 100) and that of boys is 71. Determine the mean score of the whole class.
Total number of students = 50.
Number of girls = 30.
Number of boys= 50 − 30 = 20.
Mean marks scored by girls = 73.
⇒ (sum of the marks of girls/number of girls) = mean marks scored by girls
⇒ (sum of the marks of girls/30) = 73
⇒ sum of the marks of girls = 73 x 30
⇒ sum of the marks of girls = 2190
Mean marks scored by boys = 71.
⇒ (sum of the marks of boys/number of boys) = mean marks scored by boys
⇒ (sum of the marks of boys/20) = 71
⇒ sum of the marks of girls = 71 x 20
⇒ sum of the marks of girls = 1420
Total sum of marks = 2190 + 1420 = 3610
⇒ (Total sum of the marks/Total number of student) = mean score of the whole class
⇒ (3610/50) = mean score of the whole class
⇒ mean score of the whole class is 72.2
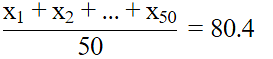
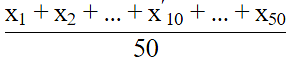
Q.12. Mean of 50 observations was found to be 80.4. But later on, it was discovered that 96 was misread as 69 at one place. Find the correct mean.
Say x10 (incorrect value) = 69
x′10 (correct value) = 96 = x10 +27
x1 + x2 + ... + x50 = 4020
Add 27 on both sides
x1 + x2 + ... + x50 + 27 = 4020 + 27 = 4047
x1 + x2 + ... + x'10 + ... + x50 = 4047
Actual mean =
Therefore, 4047/50 = 80.94.
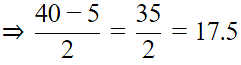
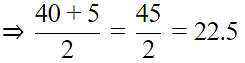
Q.13. Ten observations 6, 14, 15, 17, x + 1, 2x – 13, 30, 32, 34, 43 are written in an ascending order. The median of the data is 24. Find the value of x.
Here, the observations are:
6, 14, 15, 17, x + 1, 2x – 13, 30, 32, 34, 43
To calculate the median, arrange the given data in ascending order and then find the middle term. This middle term is called the median. The terms are already given in ascending order so we have to find the middle term.
Number of ten= (even)

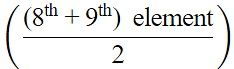
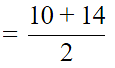
Q.14. The points scored by a basket ball team in a series of matches are as follows:
17, 2, 7, 27, 25, 5, 14, 18, 10, 24, 48, 10, 8, 7, 10, 28
Find the median and mode for the data.
Arrange in ascending order = 2, 5, 7, 7, 8, 10, 10, 10, 14, 17, 18, 24, 25, 27, 28, 48
Total 16 elements
So median =
= 12
mode = 10 (3 times repeating)
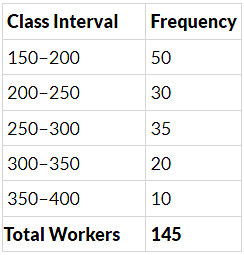
Q.15. In Fig. 14.2, there is a histogram depicting daily wages of workers in a factory. Construct the frequency distribution table.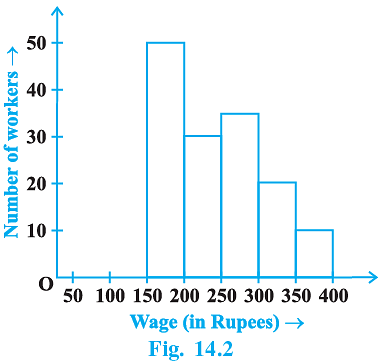
Frequency Distribution table for Daily wages & Number of workers is:
Hence, the total number of workers is 145.
Q.16. A company selected 4000 households at random and surveyed them to find out a relationship between income level and the number of television sets in a home. The information so obtained is listed in the following table: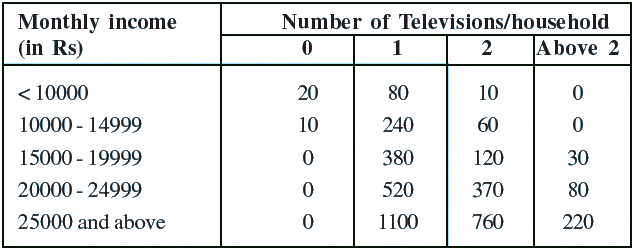
Find the probability:
(i) of a household earning Rs. 10000 – Rs. 14999 per year and having exactly one television.
(ii) of a household earning Rs. 25000 and more per year and owning 2 televisions.
(iii) of a household not having any television.
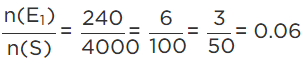
The total number of the households selected by the company, n(S) = 4000
(i) Number of households earning Rs.10000 - Rs. 14999 per year and having exactly one television, n(E1) = 240.
∴ Required probability =
Hence, the probability of a household earning Rs. 10000− Rs. 14999 per year and having exactly one television is 0.06.
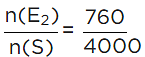
(ii) Number of households earning Rs.25000 and more per year owning 2 televisions, n(E2) = 760.
∴ Required probability =
= 0.19
Hence, the probability of a household earning Rs. 25000 and more per year owning 2 televisions is 0.19.
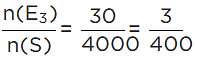
(iii) Number of household not having any television, n(E3) = 30
∴ Required probability =
Hence, the probability of a household not having any television is (3/400).
Q.17. Two dice are thrown simultaneously 500 times. Each time the sum of two numbers appearing on their tops is noted and recorded as given in the following table: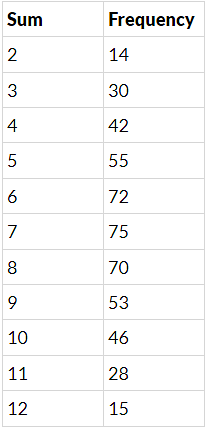
If the dice are thrown once more, what is the probability of getting a sum
(i) 3?
(ii) more than 10?
(iii) less than or equal to 5?
(iv) between 8 and 12?
Sum 2 3 4 5 6 7 8 9 10 11 12
Frequency 14 30 42 55 72 75 70 53 46 28 15
Total outcomes = 500
(i) P[of getting a sum 3] = 30/500
= 3/50
= 0.06
(ii) Probability of getting a sum more than 10
Favorable events
P P of getting sum more than 10= 43/500 = 0.086=43500=
(iii) P[sum less than or equal to 5] = 141/500
= 28.2/100
= 0.282
(iv) P[sum between 8 and 12] = 127/500
= 25.4/100
= 0.254
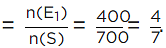
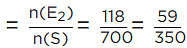
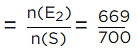
Q.18. Bulbs are packed in cartons each containing 40 bulbs. Seven hundred cartons were examined for defective bulbs and the results are given in the following table: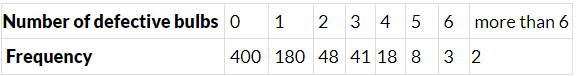
One carton was selected at random. What is the probability that it has
(i) no defective bulb?
(ii) defective bulbs from 2 to 6?
(iii) defective bulbs less than 4?
Total number of cartons, n(S) = 700
(i) Number of cartons which has no defective bulb, n(E1) = 400
∴ Probability that no defective bulb =
Hence, the probability that no defective bulb is (4/7)
(ii) Number of cartons which has defective bulbs from 2 to 6, n(E2) = 48 + 41 + 18 + 8 + 3 = 118
∴ Probability that the defective bulb from 2 to 6
Hence, the probability that the defective bulb from 2 to 6 is (59/350)
(iii) Number of cartons which has defective bulb less than 4,
n(E3) = 400 + 180 + 48 + 41 = 669.
∴ The Probability that the defective bulbs less than 4
Hence, the probability that the defective bulb less than 4 is (669/700)
Q.19. Over the past 200 working days, the number of defective parts produced by a machine is given in the following table:
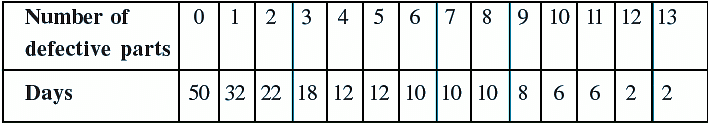
Determine the probability that tomorrow’s output will have
(i) no defective part
(ii) atleast one defective part
(iii) not more than 5 defective parts
(iv) more than 13 defective parts
Total number of working days, n(S) = 200
(i) Number of days in which no part is defective, n(E1) = 50
∴ Probability of no defective part is, (50/200) = 0.25
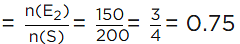
(ii) Number of days in which atleast one part is defective,
n(E2) = 32 + 22 + 18 + 12 + 12 + 10 + 10 + 10 + 8 + 6 + 6 + 2 + 2 = 150
∴ Probability that atleast one defective part
Hence, the probability of least one defective part is 0.75.
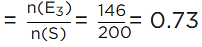
(iii) Number of days in which not more than 5 parts are defective,
n(E3) = 50 + 32 + 22 + 18 + 12 + 12 = 146
∴ Probability of not more than 5 defective parts
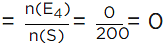
(iv) Number of days in which not more than 13defective parts,
n(E4) = 0
∴ Probability for more than 13 defective parts
Hence, the probability of more than 13 defective parts is 0.
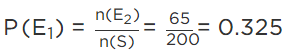
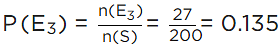
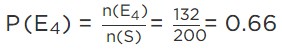
Q.20. A recent survey found that the ages of workers in a factory is distributed as follows: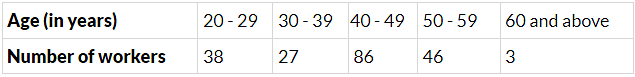
If a person is selected at random, find the probability that the person is:
(i) 40 years or more
(ii) under 40 years
(iii) having age from 30 to 39 years
(iv) under 60 but over 39 years
Total number of workers in the factory, n(S) = 38 + 27 + 86 + 46 + 3 = 200
(i) Number of persons selected at the age of 40 years or more, n(E1) = 86 + 46 + 3 = 135
∴ Probability that the persons selected at the age of 40 years or more,
P(E1) = n(E1)/n(S) = 135/200 = 0.675
(ii) Number of persons selected under the age of 40 years, n(E2) = 38 + 27 = 65
∴ Probability that the persons selected under the age of 40 years,
(iii) Number of persons selected having age from 30 to 39 years, n(E3) = 27
∴ Probability that the persons selected having age from 30 to 39 years,
(iv) Number of persons selected having age under 60 nut over 39 years,
n(E4) = 86 + 46 = 132
∴ Probability that the persons selected having age under 60 but over 39 years,
Exercise 14.4
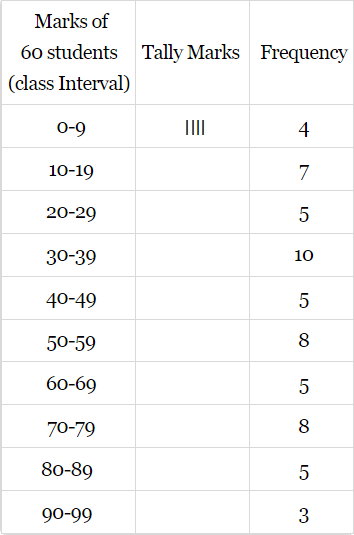
Q.1. The following are the marks (out of 100) of 60 students in mathematics.
16, 13, 5, 80, 86, 7, 51, 48, 24, 56, 70, 19, 61, 17, 16, 36, 34, 42, 34, 35, 72, 55, 75, 31, 52, 28,72, 97, 74, 45, 62, 68, 86, 35, 85, 36, 81, 75, 55, 26, 95, 31, 7, 78, 92, 62, 52, 56, 15, 63,25, 36, 54, 44, 47, 27, 72, 17, 4, 30.
Construct a grouped frequency distribution table with width 10 of each class starting from 0 - 9.
Arranging the following data in ascending order:
4, 5, 7, 7, 13, 15, 16, 16, 17, 17, 19, 24, 25, 26, 27, 28, 30, 31, 34, 34, 35, 35, 36, 36, 36, 42, 44, 45, 47, 48, 51, 52, 52, 54, 55, 55, 56, 56, 61, 62, 62, 63, 68, 70, 72, 72, 72, 74, 75, 75, 78, 80,, 81, 85, 86, 86, 92, 95, 97.
Total frequency = 60.
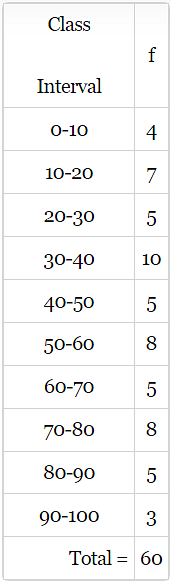
Q.2. Refer to Q1 above. Construct a grouped frequency distribution table with width 10 of each class, in such a way that one of the classes is 10 - 20 (20 not included).
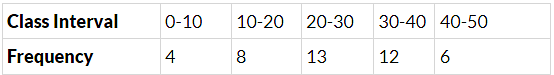
Q.3. Draw a histogram of the following distribution :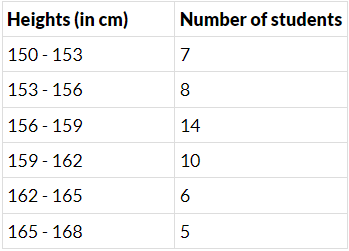
The given distribution is in exclusive form. So, we can take the class-intervals as (0−5),(5−10) etc. along the x−axis and frequency along y−axis. Choosing a proper scale, we can construct a histogram as shown in the figure.
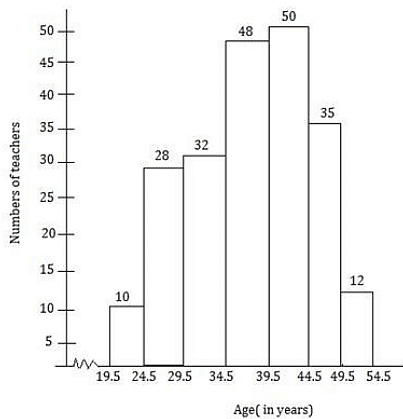
Q.4. Draw a histogram to represent the following grouped frequency distribution: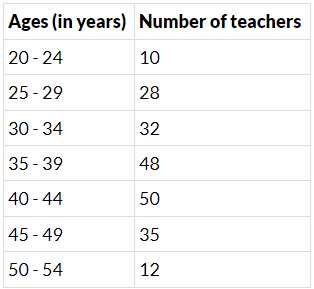
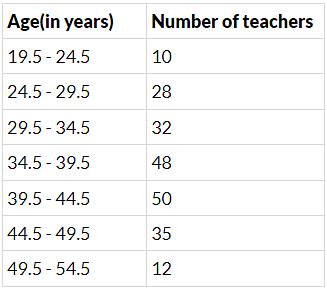
The given frequency distribution is in the inclusive form.
First, we convert it into exclusive form.
Now, consider the classes 20-24, 25-29.
The lower limit of 25-29 is 25.
The upper limit of 20-24 is 24.
Thus, the half of the difference is (25-24)/2 = 1/2 = 0.5
So, we subtract 0.5 from each lower limit and add 0.5 to each upper limit.
The table for continuous grouped frequency distribution is given below.Thus, the given data becomes in exclusive form.
Along the horizontal axis, we represent the class intervals of ages on some suitable scale. The corresponding frequencies of the number of teachers are represented along the vertical axis on a suitable scale.
Since the given intervals start with 19.5 - 24.5. it means that there is some break indicated near the origin to signify the graph is drawn with a scale beginning at 19.5.
A histogram of the given distribution is given below.
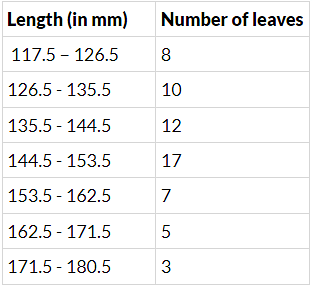
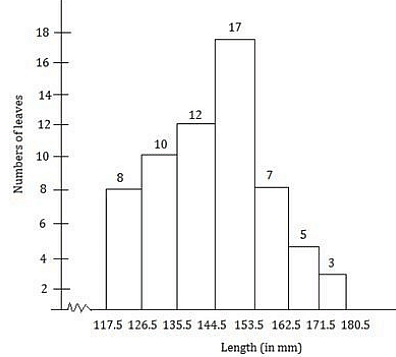
Q.5. The lengths of 62 leaves of a plant are measured in millimetres and the data is represented in the following table :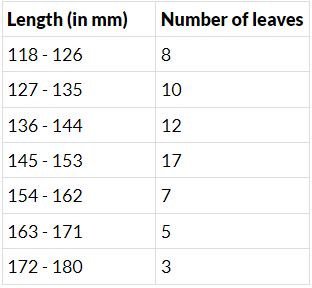
Draw a histogram to represent the data above.
The given frequency distribution is in the inclusive form. First, we convert it into exclusive form.
Now, adjusting factor = (127-126)/2 = 1/2 = 0.5
So, we subtract 0.5 from each lower limit and add 0.5 to each upper limit.
The table for continuous grouped frequency distribution is given below.
Thus, the given data becomes in the exclusive form.
Along the horizontal axis, we represent the class intervals of length on some suitable scale.
The corresponding frequencies of the number of leaves are represented along the Y-axis on a suitable scale.
The given intervals start with 117.5 - 126.5. It means that there is some break (≈) indicated near the origin to signify the graph is drawn with a scale beginning at 117.5.
A histogram of the given distribution is given below.
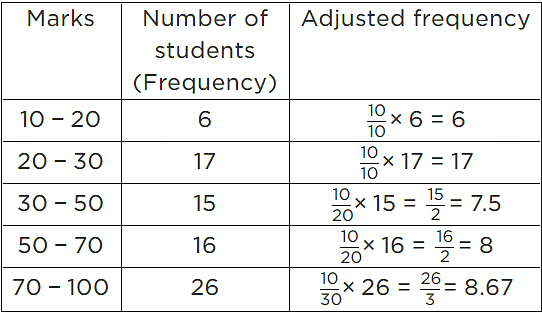
Q.6. The marks obtained (out of 100) by a class of 80 students are given below :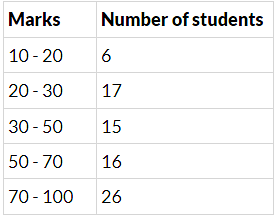
Construct a histogram to represent the data above.
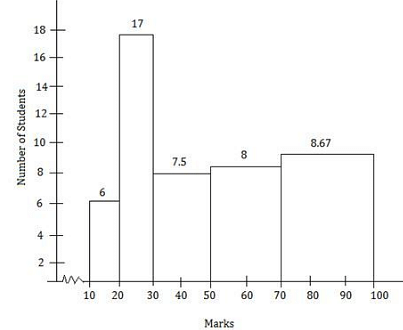
In the given frequency distribution, class sizes are different. So, we calculate the adjusted frequency for each class.
Here, minimum size = 20 - 10 = 10
We use the formula,
Adjusted frequency of a class = (Minimum Class size/Class size of this class) x (Its frequency)
The modified table for frequency distribution is given below.
Along the horizontal axis, we represent the class intervals of marks on some suitable scale.
The corresponding frequencies of the number of students are represented along the Y-axis on a suitable scale. The given intervals start with 10 - 20. It means that there is some break (≈) indicated near the origin to signify the graph is drawn with a scale beginning at 10.
Now, we draw rectangles with class intervals as the bases and the corresponding adjusted frequencies as heights.
A histogram of the given distribution is given below.
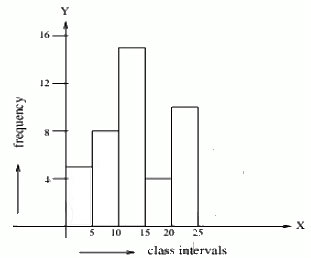
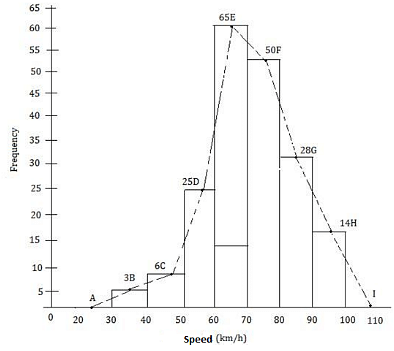
Q.7. Following table shows a frequency distribution for the speed of cars passing through at a particular spot on a high way :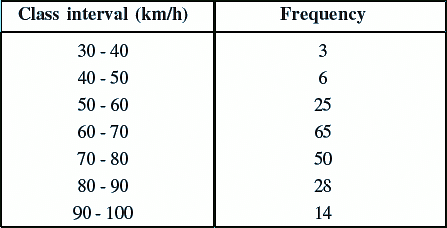
Draw a histogram and frequency polygon representing the data above.
Clearly, the given frequency distribution is exclusive form.
Along the horizontal axis, we represent the class intervals of length on some suitable scale.
The corresponding frequencies are represented along the vertical axis on a suitable scale.
We construct rectangles with class intervals as the bases and the respective frequencies as the heights.
Let us draw a histogram for this data and mark the midpoints of the top of the rectangles as B, C, D, E, F, G and H respectively. Here, the first class is 30 - 40 and the last class is 90 - 100.
Also, consider the imagined classes 20 - 30 and 100 - 110 each with frequency 0. The class marks of these classes are 25 and 105 at the points A and l, respectively.Join all these points using a dotted line.
Then, the curve ABCDEFGHI is the required frequency polygon.
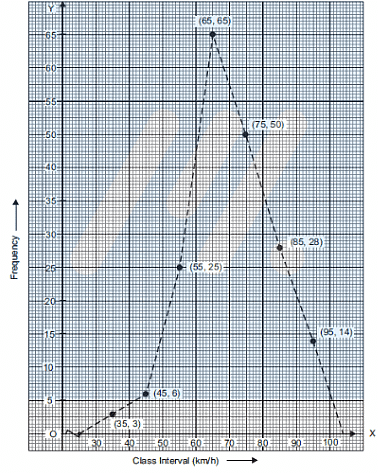
Q.8. Draw the frequency polygon representing the above data without drawing the histogram.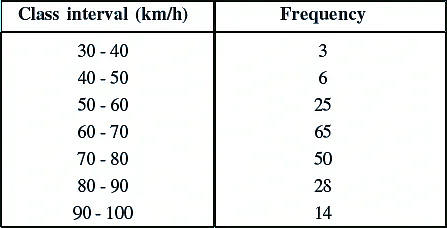
First, we obtain the class marks as given in the following table.
Now, we plot the points (35,3) (45,6) (55,25) (65,65) (75,50) (85,28)and (95, 14).
Now, we join the plotted points by line segments. The end points (35, 3) and (95, 14) are joined to the mid-points (25, 0) and (105, 0) respectively of imagined class-intervals to obtain the frequency polygon.

Q.9. Following table gives the distribution of students of sections A and B of a class according to the marks obtained by them.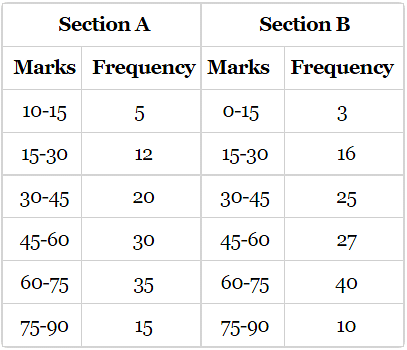
Represent the marks of the students of both the sections on the same graph by two frequency polygons. What do you observe?
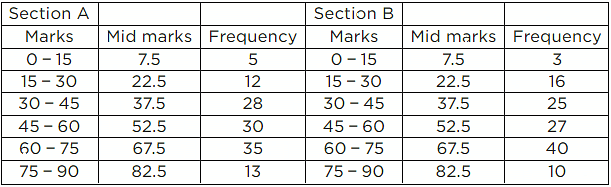
Firstly, we find the mid marks of the given sections A and B by using the formula,
Class mark = (Lower limit + Upper limit)/2
The new table for section A and B is shown below.
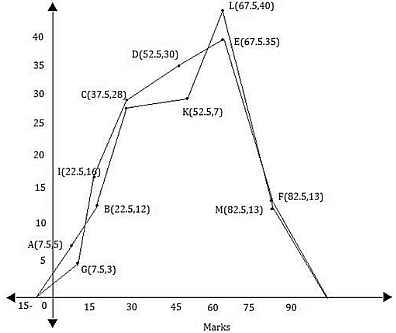
We can draw a frequency polygon by plotting the class marks along the horizontal axis and the frequency along the vertical axis.
Now, plotting all the points A(7.5, 5), B(22.5, 12), C(37.5, 28), D(52.5, 30), E(67.5, 35), F(82.5, 13) for section A.
Also, plotting all the points H(7.5, 3), l(22.5, 16), J(37.5, 25), K(52.5, 27), L(67.5, 40) and M(82.5, 10) for section B.
It is clear from the graph that maximum marks 67.5 scored by 40 students in section B.
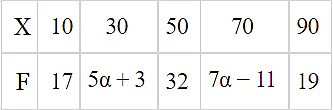
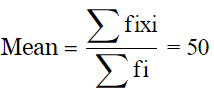
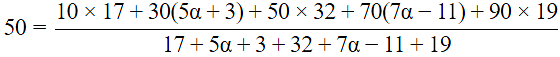
Q.10. The mean of the following distribution is 50.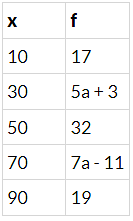
Find the value of a and hence the frequencies of 30 and 70.
50(12α + 60) = 640α + 2800
3000 + 600α = 640α + 2800
40α = 200
α = 5
frequency of 30 = 5α + 3 = 25 + 3 = 28
frequency of 70 = 7α − 11 = 35 − 11 = 24.
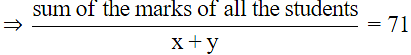
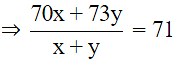
Q.11. The mean marks (out of 100) of boys and girls in an examination are 70 and 73, respectively. If the mean marks of all the students in that examination is 71, find the ratio of the number of boys to the number of girls.
Let the total number of boys be x and the total number of girls br y.
Let the sum of the marks of boys be a and the sum of the marks of girls be b.
Mean marks of boys are = 70
Mean marks of girls are = 73
Therefore,
⇒ (a/x) = 70
⇒ a = 70x
and
⇒ b/y = 73
⇒ b = 73y
Now, mean marks of all the students is 71
Therefore,⇒ sum of the marks of all the students = a + b
⇒ a + b = 70x + 73y
Therefore,
⇒ 70x + 73y = 71x + 71y
⇒ 2y = x
Hence the ratio is 2 : 1.

Q.12. A total of 25 patients admitted to a hospital are tested for levels of blood sugar, (mg/dl) and the results obtained were as follows :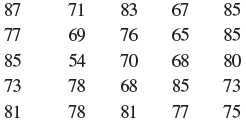
Find mean, median and mode (mg/dl) of the above data.
(i) First let us find the meaning.
We know that the mean is the ratio of the sum of observations to the number of observations. For the above data the sum of all the blood sugar levels is and the total number of patients is .
Mean =
Mean = 75.64=
(ii) Now, let us find the median.
Arranging the data in ascending order we have,
54, 65, 67, 68, 69, 70, 71, 73, 73, 75, 76, 77, 77, 78, 80, 81, 81, 83, 85, 85, 85, 85, 85
We can see that the total number of patients is which is odd, so the median will be term.(
Median term (25+12)th
Median term=13th
Median= 77 =77(mg/dl)
(iii) Finally, let us find the mode.
The mode is the observation which appears the most in the data. We can see that appears the most number of times.85
Mode =85=85(mg/dl)
|
44 videos|412 docs|54 tests
|
FAQs on NCERT Exemplar Solutions: Statistics - Mathematics (Maths) Class 9
| 1. What is the importance of statistics in Class 9? |  |
| 2. How can students apply statistics in their daily lives? | |
| 3. What are the different types of data representation techniques taught in Class 9 statistics? | |
| 4. How can students improve their understanding of statistics concepts? | |
| 5. What career opportunities are available for students with a strong background in statistics? | |

|
4.97/5 Rating |

|
Dec 23, 2024 Last updated |

|
Explore Courses for Class 9 exam
|
|
MCQs
,mock tests for examination
,shortcuts and tricks
,Extra Questions
,Free
,Exam
,NCERT Exemplar Solutions: Statistics | Mathematics (Maths) Class 9
,study material
,video lectures
,Viva Questions
,ppt
,Important questions
,NCERT Exemplar Solutions: Statistics | Mathematics (Maths) Class 9
,Summary
,Objective type Questions
,Semester Notes
,NCERT Exemplar Solutions: Statistics | Mathematics (Maths) Class 9
,past year papers
,Previous Year Questions with Solutions
,Sample Paper
,practice quizzes
;


NCERT Exemplar Solutions: Statistics Free PDF Download
Importance of NCERT Exemplar Solutions: Statistics
NCERT Exemplar Solutions: Statistics Notes
NCERT Exemplar Solutions: Statistics Class 9 Questions
Study NCERT Exemplar Solutions: Statistics on the App
|
© EduRev
|
Education Revolution
|


|


