Mean, Median and Mode | The Complete SAT Course - Class 10 PDF Download
Mean
The arithmetic mean of a given data is the sum of all observations divided by the number of observations. For example, a cricketer's scores in five ODI matches are as follows: 12, 34, 45, 50, 24. To find his average score in a match, we calculate the arithmetic mean of data using the mean formula:
- Mean = Sum of all observations/Number of observations
- Mean = (12 + 34 + 45 + 50 + 24)/5
- Mean = 165/5 = 33
- Mean is denoted by x̄ (pronounced as x bar).
Types of Data
- Data can be present in raw form or tabular form. Let's find the mean in both cases.
Raw Data
- Let x1, x2, x3 , . . . , xn be n observations.
- We can find the arithmetic mean using the mean formula.
- Mean, x̄ = (x1 + x2 + ... + xn)/n
Example: If the heights of 5 people are 142 cm, 150 cm, 149 cm, 156 cm, and 153 cm. Find the mean height.
Mean height, x̄ = (142 + 150 + 149 + 156 + 153)/5
= 750/5
= 150
Mean, x̄ = 150 cm
Thus, the mean height is 150 cm.
Frequency Distribution (Tabular) Form
When the data is present in tabular form, we use the following formula:
Mean, x̄ = (x1f1 + x2f2 + ... + xnfn)/(f1 + f2 + ... + fn)
Consider the following example.
Example 1: Find the mean of the following distribution: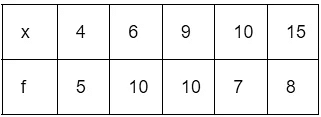
Calculation table for arithmetic mean:
Mean, x̄ = (∑xi fi)/(∑fi)
= 360/40
= 9
Thus, Mean = 9
Example 2: Here is an example where the data is in the form of class intervals. The following table indicates the data on the number of patients visiting a hospital in a month. Find the average number of patients visiting the hospital in a day.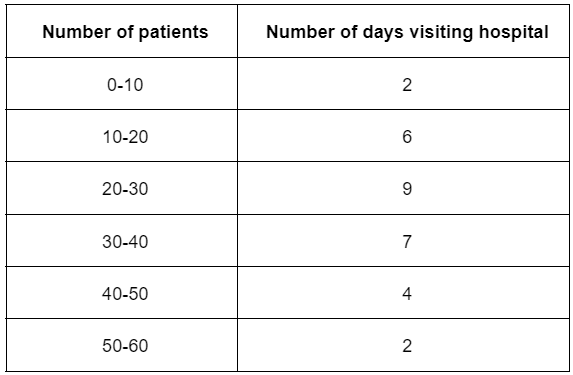
In this case, we find the classmark (also called as mid-point of a class) for each class.
Note: Class mark = (lower limit + upper limit)/2
Let x1, x2, x3 , . . . , xn be the class marks of the respective classes.
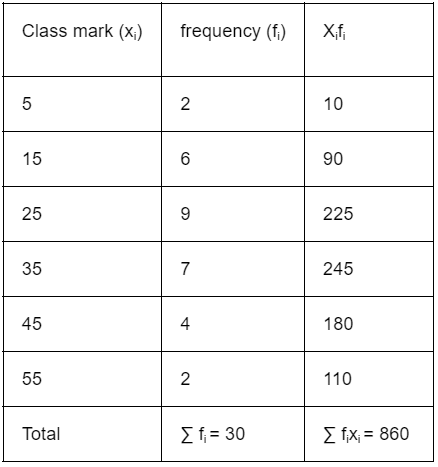
Hence, we get the following table:Mean, x̄ = (∑xi fi)/(∑fi)
= 860/30
= 28.67
x̄ = 28.67
Challenging Question:
Let the mean of x1, x2, x3 … xn be A, then what is the mean of:
(x1 + k), (x2 + k), (x3 + k), … , (xn + k)
(x1 - k), (x2 - k), (x3 - k), … , (xn - k)
kx1, kx2, kx3, … , kxn
Median
The value of the middlemost observation, obtained after arranging the data in ascending or descending order, is called the median of the data.
For example, consider the data: 4, 4, 6, 3, 2. Let's arrange this data in ascending order: 2, 3, 4, 4, 6. There are 5 observations. Thus, median = middle value i.e. 4.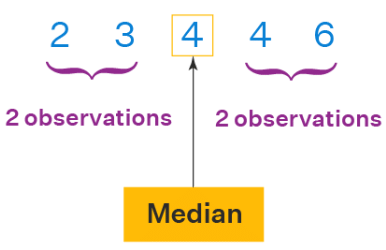 Case 1: Ungrouped Data
- Step 1: Arrange the data in ascending or descending order.
- Step 2: Let the total number of observations be n.
To find the median, we need to consider if n is even or odd. If n is odd, then use the formula:
Median = (n + 1)/2th observation
Example 1: Let's consider the data: 56, 67, 54, 34, 78, 43, 23. What is the median?
Arranging in ascending order, we get: 23, 34, 43, 54, 56, 67, 78. Here, n (number of observations) = 7
So, (7 + 1)/2 = 4
∴ Median = 4th observation
Median = 54
If n is even, then use the formula:
Median = [(n/2)th obs.+ ((n/2) + 1)th obs.]/2
Example 2: Let's consider the data: 50, 67, 24, 34, 78, 43. What is the median?
Arranging in ascending order, we get: 24, 34, 43, 50, 67, 78.
Here, n (no.of observations) = 6
6/2 = 3
Using the median formula,
Median = (3rd obs. + 4th obs.)/2
= (43 + 50)/2
Median = 46.5
Case 2: Grouped Data
When the data is continuous and in the form of a frequency distribution, the median is found as shown below:
- Step 1: Find the median class.
Let n = total number of observations i.e. ∑ fi
Note: Median Class is the class where (n/2) lies. - Step 2: Use the following formula to find the median.

where,
- l = lower limit of median class
- c = cumulative frequency of the class preceding the median class
- f = frequency of the median class
- h = class size
Let's consider the following example to understand this better.
Example: Find the median marks for the following distribution:

We need to calculate the cumulative frequencies to find the median.
Calculation table:
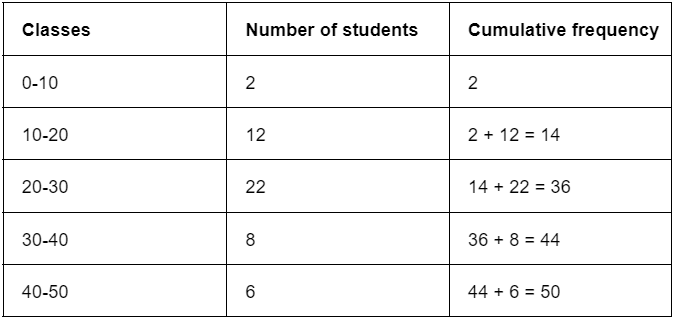 N/2 = 50/2 = 25
Median Class = (20 - 30)
l = 20, f = 22, c = 14, h = 10
Using Median formula:
= 20 + (25 - 14)/22 × 10
= 20 + (11/22) × 10
= 20 + 5 = 25
∴ Median = 25
Mode
- The value which appears most often in the given data i.e. the observation with the highest frequency is called a mode of data.
Case 1: Ungrouped Data
- For ungrouped data, we just need to identify the observation which occurs maximum times.
Mode = Observation with maximum frequency
For example in the data: 6, 8, 9, 3, 4, 6, 7, 6, 3, the value 6 appears the most number of times. Thus, mode = 6. An easy way to remember mode is: Most Often Data Entered. Note: A data may have no mode, 1 mode, or more than 1 mode. Depending upon the number of modes the data has, it can be called unimodal, bimodal, trimodal, or multimodal.
The example discussed above has only 1 mode, so it is unimodal.
Case 2: Grouped Data
When the data is continuous, the mode can be found using the following steps:
- Step 1: Find modal class i.e. the class with maximum frequency.
- Step 2: Find mode using the following formula:

where,
- l = lower limit of modal class,
- fm = frequency of modal class,
- f1 = frequency of class preceding modal class,
- f2 = frequency of class succeeding modal class,
- h = class width
Consider the following example to understand the formula.
Example: Find the mode of the given data:
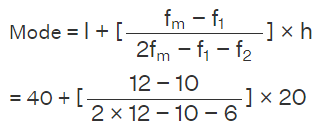
The highest frequency = 12, so the modal class is 40-60.
- l = lower limit of modal class = 40
- fm = frequency of modal class = 12
- f1 = frequency of class preceding modal class = 10
- f2 = frequency of class succeeding modal class = 6
- h = class width = 20
Using the mode formula,
= 40 + (2/8) × 20
= 45
∴ Mode = 45
Mean, Median and Mode Formulas
- We covered the formulas and method to find the mean, median, and mode for grouped and ungrouped set of data. Let us summarize and recall them using the list of mean, median, and mode formulas given below,
- Mean formula for ungrouped data: Sum of all observations/Number of observations
- Mean formula for grouped data: x̄ = (x1f1 + x2f2 + ... + xnfn)/(f1 + f2 + ... + fn)
- Median formula for ungrouped data: If n is odd, then use the formula: Median = (n + 1)/2th observation. If n is even, then use the formula: Median = [(n/2)th obs.+ ((n/2) + 1)th obs.]/2
Median formula for grouped data: Median = 
where,
- l = lower limit of median class
- c = cumulative frequency of the class preceding the median class
- f = frequency of the median class
- h = class size
Mode formula for ungrouped data: Mode = Observation with maximum frequency
Mode formula for grouped data: Mode = 
where,
- l = lower limit of modal class,
- fm = frequency of modal class,
- f1 = frequency of class preceding modal class,
- f2 = frequency of class succeeding modal class,
- h = class width
Relation Between Mean, Median and Mode
- The three measures of central values i.e. mean, median, and mode are closely connected by the following relations (called an empirical relationship).
2Mean + Mode = 3Median - For instance, if we are asked to calculate the mean, median, and mode of continuous grouped data, then we can calculate mean and median using the formulas as discussed in the previous sections and then find mode using the empirical relation.
For example, we have data whose mode = 65 and median = 61.6. - Then, we can find the mean using the above mean, median, and mode relation.
2Mean + Mode = 3 Median
∴ 2Mean = 3 × 61.6 - 65
∴ 2Mean = 119.8
⇒ Mean = 119.8/2
⇒ Mean = 59.9
Difference Between Mean and Average
- The term average is frequently used in everyday life to denote a value that is typical for a group of quantities. Average rainfall in a month or the average age of employees of an organization is a typical example. We might read an article stating "People spend an average of 2 hours every day on social media. " We understand from the use of the term average that not everyone is spending 2 hours a day on social media but some spend more time and some less.
- However, we can understand from the term average that 2 hours is a good indicator of the amount of time spent on social media per day. Most people use average and mean interchangeably even though they are not the same.
- Average is the value that indicates what is most likely to be expected.
- They help to summarise large data into a single value.
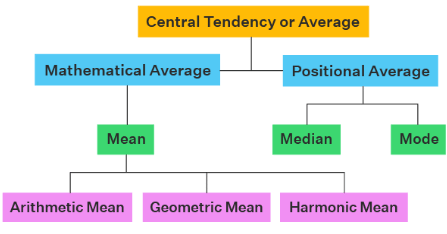
- An average tends to lie centrally with the values of the observations arranged in ascending order of magnitude. So, we call an average measure of the central tendency of the data. Averages are of different types. What we refer to as mean i.e. the arithmetic mean is one of the averages. Mean is called the mathematical average whereas median and mode are positional averages.
Difference Between Mean and Median
- Mean is known as the mathematical average whereas the median is known as the positional average. To understand the difference between the two, consider the following example. A department of an organization has 5 employees which include a supervisor and four executives. The executives draw a salary of ₹10,000 per month while the supervisor gets ₹40,000.
Mean = (10000 + 10000 + 10000 + 10000 + 40000)/5 = 80000/5 = 16000 - Thus, the mean salary is ₹16,000.
- To find the median, we consider the ascending order: 10000, 10000, 10000, 10000, 40000.
n = 5,
so, (n + 1)/2 = 3
Thus, the median is the 3rd observation.
Median = 10000 - Thus, the median is ₹10,000 per month.
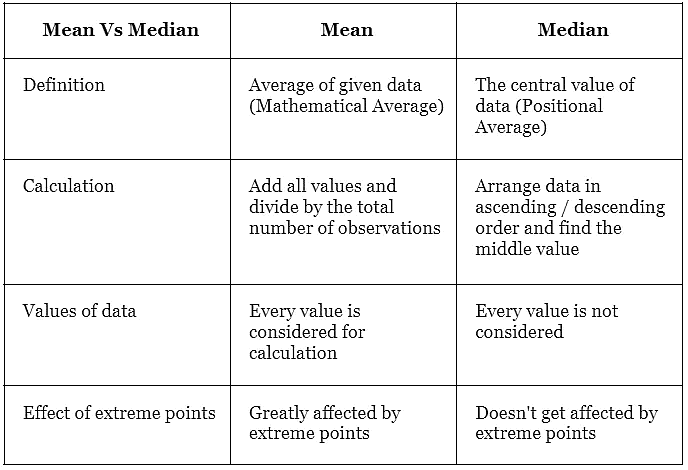
- Now let us compare the two measures of central tendencies.
- We can observe that the mean salary of ₹16,000 does not give even an estimated salary of any of the employees whereas the median salary represents the data more effectively.
- One of the weaknesses of mean is that it gets affected by extreme values.
- Look at the following graph to understand how extreme values affect mean and median:
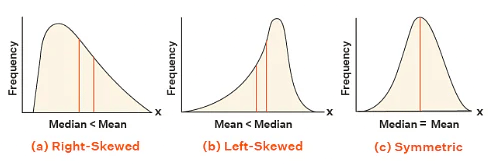
- So, mean is to be used when we don't have extremes in the data.
- If we have extreme points, then the median gives a better estimation.
- Here's a quick summary of the differences between the two.
|
433 videos|220 docs|166 tests
|

