Speed Time & Distance Time Graphs

Speed Time Graphs
In a speed-time graph speed is always plotted on the vertical axis and time is always plotted on the horizontal. This represents the motion of a particle accelerating from a speed at time 0 , u , to a speed v at time t.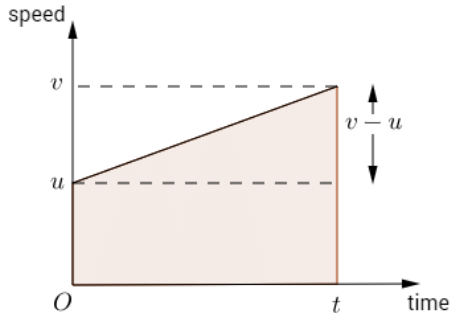 The gradient of the line of the speed-time graph is the acceleration of the particle (for straight lines acceleration is constant).
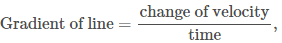

The area under the speed-time graph is the distance the particle travels.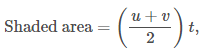
= 8.
Distance Time Graphs
Distance-time graphs and Acceleration-time graphs can also be drawn for the motion of a particle, where time is always plotted on the horizontal axis.
A straight line on a distance-time graph represents that a particle has constant speed. Curvature suggests that a particle is accelerating or decelerating.
Worked Example: Speed-time graphs and acceleration-time graphs
Example: A car drives along a straight road. The car accelerates uniformly from rest to a speed of 10 ms-1 in 2T seconds. It then travels at a constant speed for 1 minute. The car then decelerates uniformly to rest in a further 8T seconds. Sketch a speed-time graph to illustrate the motion of the car. If the total distance travelled by the car is 800 m , find the value of T and sketch and acceleration-time graph to illustrate the motion of the car.
We sketch the following speed-time graph.
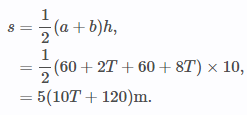
The area of a trapezium is
Where a represents the shorter of the two parallel sides of the trapezium and b represents the other. We are given that s = 800 m , so we equate this to the above expression and solve for T.
5(10T + 120) = 800,
10T + 120 = 160,
10T = 40,
T = 4.
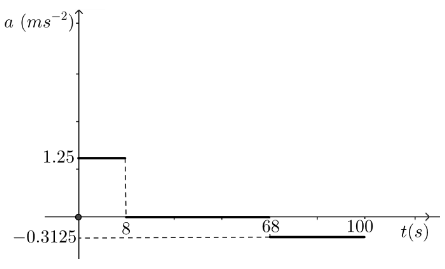
The acceleration in the first 2T = 8 seconds is given by
a = 10/8 ,
= 1.25 ms-2.
Here, for the first 8 seconds the v -coordinate increases by 10 as the t -coordinate increases by 8, this gives a positive answer. The acceleration in the last 8T = 32 seconds is given by
a = -10/32
= -0.3125 ms-2.Here, in the last 32 seconds the v-coordinate decreases by 10 as the t-coordinate increases by 32. This gives a negative answer.