Area Under Velocity-Time Graphs | Physics for Grade 10 PDF Download
| Table of contents |

|
| Introduction |

|
| Determining Distance |

|
| Solved Example |

|
| Exam Tip |

|
Introduction
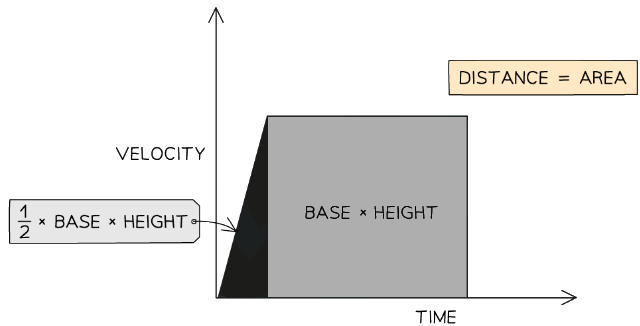
- The area under a velocity-time graph represents the displacement (or distance travelled) by an object
 The displacement, or distance travelled, is represented by the area beneath the graph
 - If the area beneath the graph forms a triangle (i.e. the object is accelerating or decelerating), then the area can be determined by using the following formula:
Area = ½ × Base × Height - If the area beneath the graph forms a rectangle (i.e. the object is moving at a constant velocity), then the area can be determined by using the following formula:
Area = Base × Height
Determining Distance
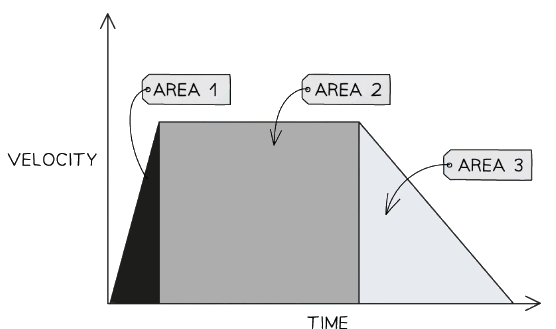
- Enclosed areas under velocity-time graphs represent total displacement (or total distance travelled)
 Three enclosed areas (two triangles and one rectangle) under this velocity-time graph represents the total distance travelled
 - If an object moves with constant acceleration, its velocity-time graph will comprise of straight lines
- In this case, calculate the distance travelled by working out the area of enclosed rectangles and triangles as in the image above
If an object moves with changing acceleration, its velocity-time graph will be a curve
In this case, estimate the distance travelled by counting the squares underneath the curve
Solved Example
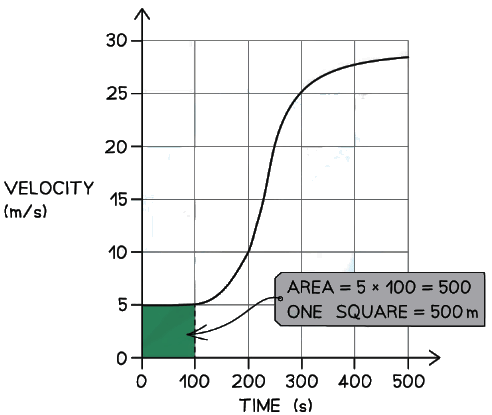
Example 1: The graph below shows how the velocity of a train changes with time as the train travels along a straight section of the journey.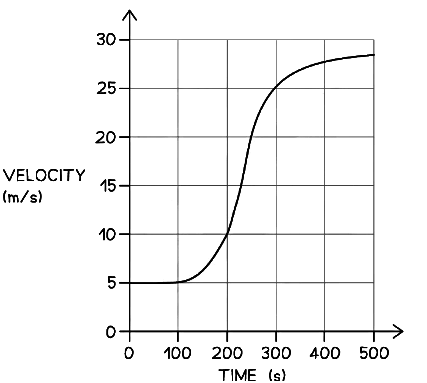
Estimate the distance travelled by the train along this section of the journey.
Step 1: Identify whether distance can be determined exactly or by estimation
(i) The train is moving with changing acceleration because the velocity-time graph is a curve
(ii) This means the distance should be estimated by counting squares underneath the curveStep 2: Determine how much distance is represented by each square on the graph
(i) The area of each square on the graph can be calculated by using the equation:
Area = Base × Height
Area = 100 × 5 = 500(ii) Therefore, the distance represented by each square is 500 m
Step 3: Write down the total number of squares underneath the curve
There are approximately 17 squares underneath the curve (including non-whole squares)Step 4: Determine the total estimated distance
The total estimated distance is found by multiplying the number of squares by the distance represented by each square:
Total estimated distance = Number of squares × Distance represented by each square
Total estimated distance = 17 × 500 = 8500 m
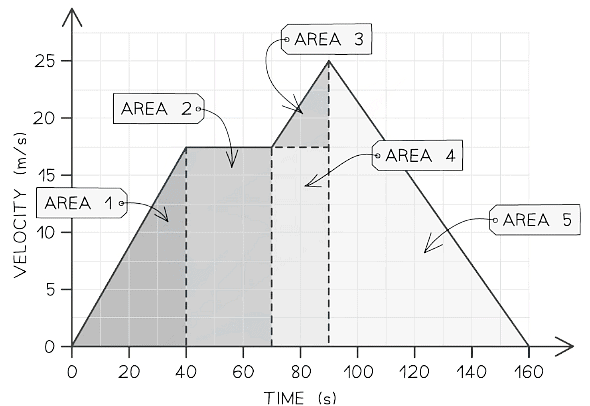
Example 2: The velocity-time graph below shows a car journey which lasts for 160 seconds.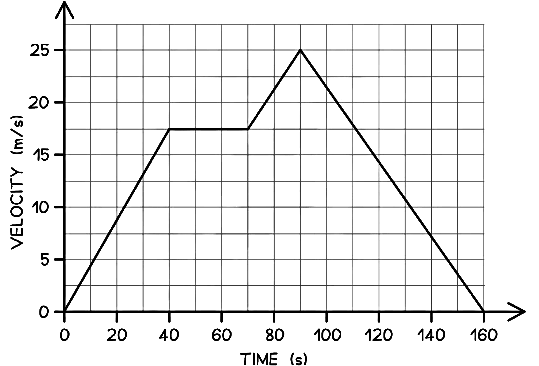
Calculate the total distance travelled by the car on this journey.
Step 1: Recall that the area under a velocity-time graph represents the distance travelled
In order to calculate the total distance travelled, the total area underneath the line must be determinedStep 2: Identify each enclosed area
In this example, there are five enclosed areas under the line
These can be labelled as areas 1, 2, 3, 4 and 5, as shown in the image below:Step 3: Calculate the area of each enclosed shape under the line
Area 1 = area of a triangle = ½ × base × height = ½ × 40 × 17.5 = 350 m
Area 2 = area of a rectangle = base × height = 30 × 17.5 = 525 m
Area 3 = area of a triangle = ½ × base × height = ½ × 20 × 7.5 = 75 m
Area 4 = area of a rectangle = base × height = 20 × 17.5 = 350 m
Area 5 = area of a triangle = ½ × base × height = ½ × 70 × 25 = 875 mStep 4: Calculate the total distance travelled by finding the total area under the line
Add up each of the five areas enclosed:
total distance = 350 + 525 + 75 + 350 + 875
total distance = 2175 m
Exam Tip
Whenever you are asked to determine the distance using a velocity-time graph, start by stating that the distance = the area under the graph.A common mistake is to try and find distance by using the equation for speed, distance and time - but this equation will not work if the object's speed is changing. In this case, you can only estimate the distance travelled by approximating the area under the graph (counting squares).
|
124 videos|149 docs|37 tests
|

|
Explore Courses for Grade 10 exam
|

|
