Levels of Organisation | Biology for Grade 10 PDF Download
| Table of contents |
|
| Producers |
|
| Food Chains |
|
| Investigating Ecosystems |
|
| Abundance of Organisms |
|
| Feeding Relationships |
|
Producers
- Photosynthetic organisms are the producers of biomass for life on Earth
- They produce their own food using energy from the Sun
- A producer has the following characteristics:
- They are at the start of every food chain (the first trophic level, which is always the biggest)
- They can photosynthesise (producers are normally green plants or algae)
- They make glucose by photosynthesis
- They use this glucose to produce other biological molecules, which then make up the producer’s biomass (some of the glucose produced is also used in respiration to release energy for the cell)
- In extreme environments (such as underwater volcanic vents) the producers are not photoautotrophs but chemoautotrophs who produce organic molecules without using energy from the Sun)
Food Chains
- A simple way to show the feeding interactions between the organisms in a community is with a food chain
- You need to know the terms given to each step in a food chain:
- Producer: food chains always begin with a producer
- Primary consumer: producers are eaten by primary consumers (herbivores/omnivores)
- Secondary consumer: primary consumers are eaten by secondary consumers (carnivores/omnivores)
- Tertiary consumer: secondary consumers are eaten by tertiary consumers (carnivores/omnivores)
 An example of a food chain
- A food chain shows the transfer of energy from one organism to the next
- The source of all energy in a food chain is light energy from the Sun
- The arrows in a food chain show the transfer of energy from one level of the food chain to the next
 Food chains table

Investigating Ecosystems
- Ecology is the branch of biology that studies the distribution and abundance of species, the interactions between species, and the interactions between species and their abiotic environment
- Ecologists are biologists that study these interactions by investigating ecosystems
- You need to know how ecologists determine the distribution and abundance of species in an ecosystem using quadrats and transects
- You need to understand how they use quadrats and transects in order to do this
Quadrats
- Quadrats are square frames made of wood or wire
- They can be a variety of sizes eg. 0.25m2 or 1m2
- They are placed on the ground and the organisms within them are recorded
- They can be used to measure the abundance of plants or slow-moving animals
 Using a quadrat to investigate population size or distribution
- Quadrats can be used to measure abundance by recording:
- The number of an individual species: the total number of individuals of a single species (eg. buttercups) is recorded
- Species richness: the total number of different species (but not the number of individuals of each species) is recorded
- Percentage cover: the approximate percentage of the quadrat area in which an individual species is found is recorded (this method is used when it is difficult to count individuals of the plant species being recorded eg. grass or moss
 How to estimate percentage cover of one or more species using a quadrat
Transects
- A transect is used to measure how the abundance of a species changes as you move along a changing habitat, eg. changing altitude on a hillside, or from open field to dense woodland, or along the shoreline at the coast
- A line called a transect is set up through the changing habitat you want to investigate with a tape measure
- A quadrat is then placed at regular intervals (eg. every 5 metres) along the transect
- At each interval, the quadrat can be used to record the number of an individual species, species richness or percentage cover
- Transects are useful for investigating how the abundance of a species is affected by an abiotic factor (e.g. light intensity, moisture levels, soil depth, altitude etc)
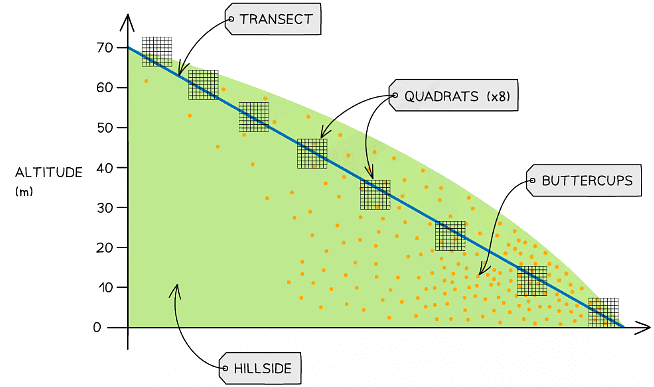 An example of a transect on a hillside. A quadrat is placed at regular intervals (every 10m of altitude gained) and counts the number of individuals (of the species being investigated eg. buttercups) in each quadrat
Exam Tip
When estimating percentage cover, you can count a square (and include it in your calculations) if more than half of it is covered by the species.
Abundance of Organisms
- When studying the abundance of organisms, you should be able to:
- Understand the terms mean, mode and median
- Calculate arithmetic means
- Plot and draw appropriate graphs selecting appropriate scales for the axes
Solved Example
A student is investigating whether buttercups are more abundant in an open field or in woodland. In each habitat, the student randomly places 10 quadrats and records the number of buttercups in each quadrat.Their results table is shown below.

Calculate the mean, median and mode buttercup abundance in each habitat.


Feeding Relationships
- Producers are eaten by primary consumers, which in turn may be eaten by secondary consumers who are themselves eaten by tertiary consumers
- Consumers that kill and eat other animals are predators, and those eaten are prey
- In a stable community the numbers of predators and prey rise and fall in cycles
- You should be able to interpret graphs used to model predator-prey cycles
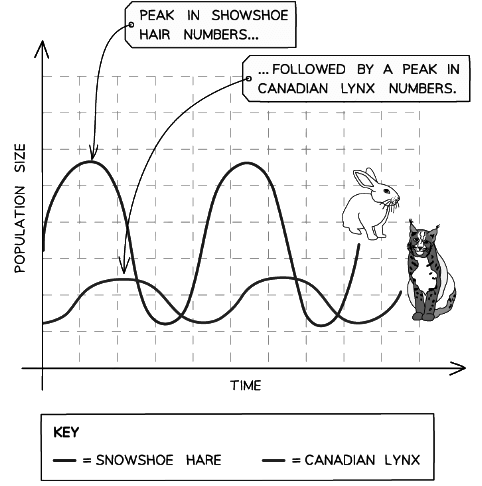 An example of a graph used to model a predator-prey cycle between the Canadian lynx and the snowshoe hare
- The graph above demonstrates some of the key patterns of predator-prey cycles:
- The number of predators increases as there is more prey available
- The number of prey then decreases as there are now more predators
- The number of predators decreases as there is now less prey available
- The number of prey increases as there are now fewer predators
- The cycle now repeats
Exam Tip
Don’t forget: predator-prey cycles are always out-of-phase with each other as it takes time for one population to respond to a change in the other population. For example, the peak in the Canadian lynx population occurs after the peak in the snowshoe hare population, as it takes time for the lynx to reproduce and for their numbers to increase.
|
110 videos|93 docs|9 tests
|

|
Dec 22, 2024 Last updated |

|
Explore Courses for Grade 10 exam
|
|
MCQs
,Exam
,Summary
,Previous Year Questions with Solutions
,video lectures
,study material
,Free
,Levels of Organisation | Biology for Grade 10
,Important questions
,Levels of Organisation | Biology for Grade 10
,mock tests for examination
,Objective type Questions
,shortcuts and tricks
,practice quizzes
,Viva Questions
,Sample Paper
,Extra Questions
,past year papers
,Levels of Organisation | Biology for Grade 10
,ppt
,Semester Notes
;


Levels of Organisation Free PDF Download
Importance of Levels of Organisation
Levels of Organisation Notes
Levels of Organisation Grade 10 Questions
Study Levels of Organisation on the App
|
© EduRev
|
Education Revolution
|


|


