Control of Blood Glucose Concentration | Biology for Grade 10 PDF Download
| Table of contents |

|
| Control of Blood Glucose Concentration by Pancreas and Insulin |

|
| Type 1 and Type 2 Diabetes |

|
| Solved Example |

|
| Role of Glucagon in Control of Blood Sugar Levels – Higher |

|
Control of Blood Glucose Concentration by Pancreas and Insulin
Regulating blood glucose
Glucose is needed by cells for respiration. It is important that the concentration of glucose in the blood is maintained at a constant level and controlled carefully. Insulin is a hormone - produced by the pancreas - that regulates glucose concentrations in the blood.
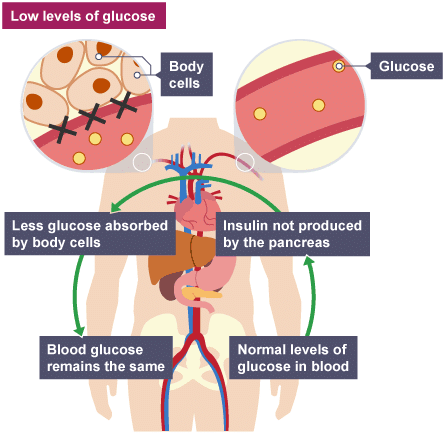
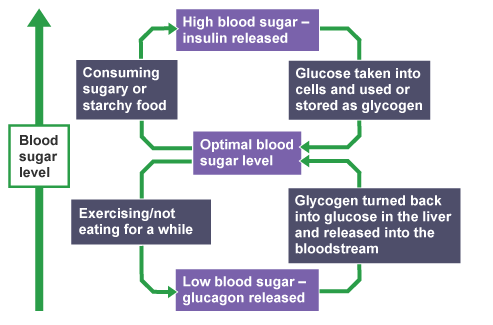
If the blood glucose concentration is too high, the pancreas produces the hormone insulin that causes glucose to move from the blood into the cells. In liver and muscle cells excess glucose is converted to glycogen for storage, and will be used at a later date.
Action of insulin
The diagram illustrates how insulin works in the body:

Type 1 and Type 2 Diabetes
Diabetes

Greg Foot explains the difference between type 1 and type 2 diabetes and the role insulin plays in controlling glucose levels
Diabetes is a condition where the blood glucose levels remain too high. It can be treated by injecting insulin. The extra insulin causes the liver to convert glucose into glycogen, which reduces the blood glucose level.
There are two types of diabetes - type 1 and type 2.
Type 1 diabetes
Type 1 diabetes is a disorder in which the pancreas fails to produce enough insulin. This can be detected from an early age. It is characterised by uncontrolled high blood glucose levels and it can be controlled by injecting insulin.
People with type 1 diabetes have to monitor their blood sugar levels throughout the day. Their levels of physical activity and their diet affect the amount of insulin needed.
They can help to control their blood glucose level by being careful with their diet, and eat foods that will not cause large increases in blood sugar level, and by exercising, which can lower blood glucose levels due to increased respiration in the muscles.
Type 2 diabetes
In type 2 diabetes the person's body cells no longer respond to insulin produced by the pancreas. It is more common in older people. It can be controlled by a carbohydrate controlled diet and an exercise regime. Carbohydrate is digested into glucose, which raises the overall blood glucose level. There is a correlation between rising levels of obesity in the general population and increasing levels of type 2 diabetes. Changes in obesity and type 2 diabetes
Solved Example
Example: Describe the pattern in this data.
The graph shows a range of data from 1990 to 2000. Mean body weight has steadily increased from approximately 72.5 kg in 1990, to 75.5 kg in 1997 up to just over 77 kg in 2000.
This matches a general increase in the number of people with type 2 diabetes from 1990 to 2000. For example, the percentage was just below 5% in 1990 up to just below 7.5% in 2000. This shows an overall increase in 2.5% over 10 years.
There are dips and minor peaks within the graph, and these may be due to the introduction of a particular type of food, or other additional factors such as lifestyle.
Tips: Use the labels on the axes to help you describe the relationship between the data in the graphs.
Role of Glucagon in Control of Blood Sugar Levels – Higher
Negative feedback
In blood glucose regulation, the hormone insulin plays a key role. When blood sugar rises in the blood, insulin sends a signal to the liver, muscles and other cells to store the excess glucose. Some is stored as body fat and other is stored as glycogen in the liver and muscles. Whereas, if the blood glucose level is too low, the liver receives a message to release some of that stored glucose into the blood. This change is brought about by another hormone produced by the pancreas called glucagon.
This is an example of negative feedback.

Action of insulin

|
110 videos|93 docs|9 tests
|

|
Explore Courses for Grade 10 exam
|

|


