Class 10 Exam  >  Class 10 Notes  >  RS Aggarwal Solutions for Class 10 Mathematics  >  RS Aggarwal Solutions: Mean, Median, Mode of Grouped Data, Cumulative Frequency Graph and Ogive- 1

RS Aggarwal Solutions: Mean, Median, Mode of Grouped Data, Cumulative Frequency Graph and Ogive- 1 | RS Aggarwal Solutions for Class 10 Mathematics PDF Download

Exercise: 9a

Q.1. If the mean of 5 observations x, x + 2, x + 4, x + 6 and x + 8 is 11, find the value of x.

Mean of the observation is given by
RS Aggarwal Solutions: Mean, Median, Mode of Grouped Data, Cumulative Frequency Graph and Ogive- 1 | RS Aggarwal Solutions for Class 10 Mathematics
So, adding the given observations, we get
Sum of the given observations = x + (x + 2) + (x + 4) + (x + 6) + (x + 8)
= x + x + 2 + x + 4 + x + 6 + x + 8
= 5x + 20
Total number of observations = 5
Mean = 11 (Given)
RS Aggarwal Solutions: Mean, Median, Mode of Grouped Data, Cumulative Frequency Graph and Ogive- 1 | RS Aggarwal Solutions for Class 10 Mathematics
⇒ 55 = 5x + 20
⇒ 5x = 55 – 20 = 35
⇒ x = 7
Thus, x = 7


Q.2. If the mean of 25 observations is 27 and each observation is decreased by 7, what will be the new mean?

Mean of the observation is given by
RS Aggarwal Solutions: Mean, Median, Mode of Grouped Data, Cumulative Frequency Graph and Ogive- 1 | RS Aggarwal Solutions for Class 10 Mathematics
Total number of observations = 25
Mean of 25 observation = 27 (Given)
We get
RS Aggarwal Solutions: Mean, Median, Mode of Grouped Data, Cumulative Frequency Graph and Ogive- 1 | RS Aggarwal Solutions for Class 10 Mathematics
⇒ Sum of 25 observations = 27 × 25 = 675
If each observation is decreased by 7, the Sum gets affected.
New Sum = 675 – (25 × 7) = 675 – 175 = 500
New mean = 500/25 = 20
Thus, new mean = 20


Q.3. Compute the mean of the following data:
RS Aggarwal Solutions: Mean, Median, Mode of Grouped Data, Cumulative Frequency Graph and Ogive- 1 | RS Aggarwal Solutions for Class 10 Mathematics

For equal class intervals, we will solve by finding mid points of these classes using direct method.
RS Aggarwal Solutions: Mean, Median, Mode of Grouped Data, Cumulative Frequency Graph and Ogive- 1 | RS Aggarwal Solutions for Class 10 Mathematics
We have got
Σfi = 20 & Σfixi = 426
∵ mean is given by
RS Aggarwal Solutions: Mean, Median, Mode of Grouped Data, Cumulative Frequency Graph and Ogive- 1 | RS Aggarwal Solutions for Class 10 Mathematics
Thus, mean is 5.325.


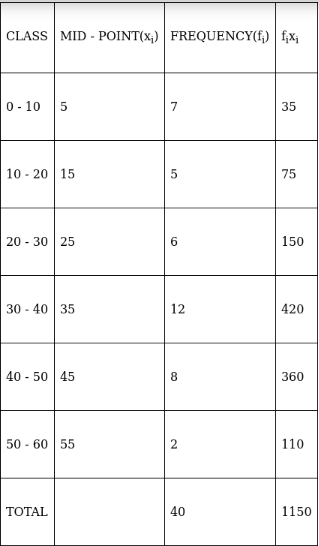
Q.4. Find the mean, using direct method:
RS Aggarwal Solutions: Mean, Median, Mode of Grouped Data, Cumulative Frequency Graph and Ogive- 1 | RS Aggarwal Solutions for Class 10 Mathematics

For equal class intervals, we will solve by finding mid points of these classes using direct method.
RS Aggarwal Solutions: Mean, Median, Mode of Grouped Data, Cumulative Frequency Graph and Ogive- 1 | RS Aggarwal Solutions for Class 10 Mathematics
We have got
Σfi = 40 & Σfixi = 1150 
∵ mean is given by
RS Aggarwal Solutions: Mean, Median, Mode of Grouped Data, Cumulative Frequency Graph and Ogive- 1 | RS Aggarwal Solutions for Class 10 Mathematics
Thus, mean is 28.75.


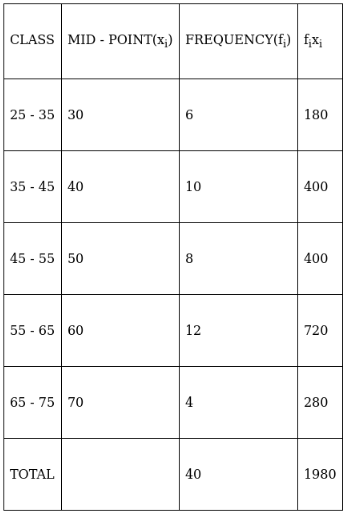
Q.5. Calculate the mean of the following data, using direct method:
RS Aggarwal Solutions: Mean, Median, Mode of Grouped Data, Cumulative Frequency Graph and Ogive- 1 | RS Aggarwal Solutions for Class 10 Mathematics

For equal class intervals, we will solve by finding mid points of these classes using direct method.
RS Aggarwal Solutions: Mean, Median, Mode of Grouped Data, Cumulative Frequency Graph and Ogive- 1 | RS Aggarwal Solutions for Class 10 Mathematics
We have got
Σfi = 40 & Σfixi = 1980 
∵ mean is given by
RS Aggarwal Solutions: Mean, Median, Mode of Grouped Data, Cumulative Frequency Graph and Ogive- 1 | RS Aggarwal Solutions for Class 10 Mathematics
RS Aggarwal Solutions: Mean, Median, Mode of Grouped Data, Cumulative Frequency Graph and Ogive- 1 | RS Aggarwal Solutions for Class 10 Mathematics 49.5
Thus, mean is 49.5.


Q.6. Compute the mean of the following data, using direct method:
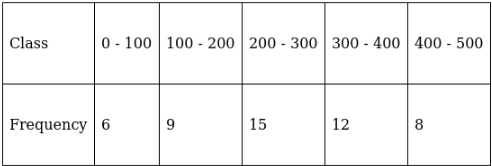
RS Aggarwal Solutions: Mean, Median, Mode of Grouped Data, Cumulative Frequency Graph and Ogive- 1 | RS Aggarwal Solutions for Class 10 Mathematics

For equal class intervals, we will solve by finding mid points of these classes using direct method.
RS Aggarwal Solutions: Mean, Median, Mode of Grouped Data, Cumulative Frequency Graph and Ogive- 1 | RS Aggarwal Solutions for Class 10 Mathematics
We have got
Σfi = 50 & Σfixi = 13200 
∵ mean is given by
RS Aggarwal Solutions: Mean, Median, Mode of Grouped Data, Cumulative Frequency Graph and Ogive- 1 | RS Aggarwal Solutions for Class 10 Mathematics
RS Aggarwal Solutions: Mean, Median, Mode of Grouped Data, Cumulative Frequency Graph and Ogive- 1 | RS Aggarwal Solutions for Class 10 Mathematics = 264
Thus, mean is 264.


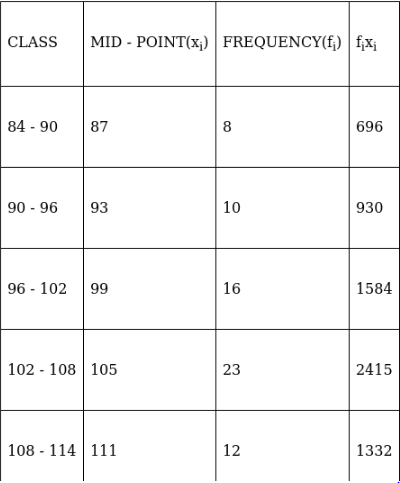
Q.7. Using an appropriate method, find the mean of the following frequency distribution:
RS Aggarwal Solutions: Mean, Median, Mode of Grouped Data, Cumulative Frequency Graph and Ogive- 1 | RS Aggarwal Solutions for Class 10 Mathematics
Which method did you use, and why?

For equal class intervals, we will solve by finding mid points of these classes using direct method.
RS Aggarwal Solutions: Mean, Median, Mode of Grouped Data, Cumulative Frequency Graph and Ogive- 1 | RS Aggarwal Solutions for Class 10 Mathematics

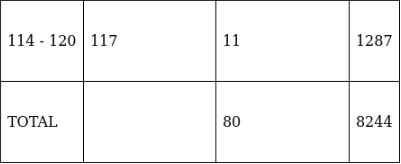
We have got
Σfi = 80 & Σfixi = 8244 
∵ mean is given by
RS Aggarwal Solutions: Mean, Median, Mode of Grouped Data, Cumulative Frequency Graph and Ogive- 1 | RS Aggarwal Solutions for Class 10 Mathematics
RS Aggarwal Solutions: Mean, Median, Mode of Grouped Data, Cumulative Frequency Graph and Ogive- 1 | RS Aggarwal Solutions for Class 10 Mathematics = 103.05
Thus, mean is 103.05
Here, the method being used is direct method as it is easy to calculate the mid - points of the class intervals and the rest calculations were simple and easy.


Q.8. If the mean of the following frequency distribution is 24, find the value of p.
RS Aggarwal Solutions: Mean, Median, Mode of Grouped Data, Cumulative Frequency Graph and Ogive- 1 | RS Aggarwal Solutions for Class 10 Mathematics

For equal class intervals, we will solve by finding mid points of these classes using direct method.
RS Aggarwal Solutions: Mean, Median, Mode of Grouped Data, Cumulative Frequency Graph and Ogive- 1 | RS Aggarwal Solutions for Class 10 Mathematics
We have got
Σfi = 12 + p & Σfixi = 270 + 25p 
∵ mean is given by
RS Aggarwal Solutions: Mean, Median, Mode of Grouped Data, Cumulative Frequency Graph and Ogive- 1 | RS Aggarwal Solutions for Class 10 Mathematics
⇒ 288 + 24p = 270 + 25p
⇒ 25p – 24p = 288 – 270
⇒ p = 18
Thus, p is 18.


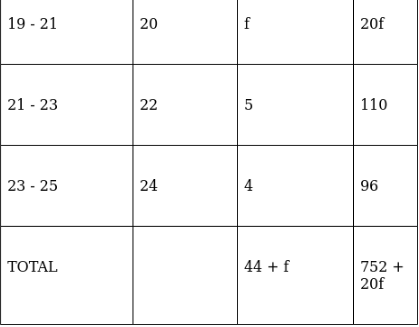
Q.9. The following distribution shows the daily pocket allowance of children of a locality. If the mean pocket allowance is Rs. 18, find the missing frequency f.
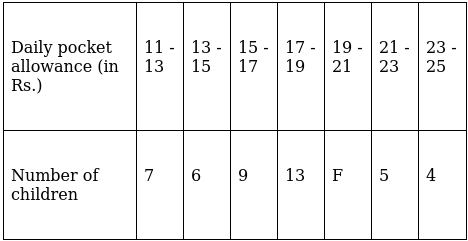
RS Aggarwal Solutions: Mean, Median, Mode of Grouped Data, Cumulative Frequency Graph and Ogive- 1 | RS Aggarwal Solutions for Class 10 Mathematics

For equal class intervals, we will solve by finding mid points of these classes using direct method.
RS Aggarwal Solutions: Mean, Median, Mode of Grouped Data, Cumulative Frequency Graph and Ogive- 1 | RS Aggarwal Solutions for Class 10 Mathematics
We have got
Σfi = 44 + f and Σfixi = 752 + 20f 
∵ mean is given by
RS Aggarwal Solutions: Mean, Median, Mode of Grouped Data, Cumulative Frequency Graph and Ogive- 1 | RS Aggarwal Solutions for Class 10 Mathematics
RS Aggarwal Solutions: Mean, Median, Mode of Grouped Data, Cumulative Frequency Graph and Ogive- 1 | RS Aggarwal Solutions for Class 10 Mathematics (∵ given: mean of pocket allowance is 18)
⇒ 792 + 18f = 752 + 20f
⇒ 20f – 18f = 792 – 752
⇒ 2f = 40
⇒ f = 20
Thus, f is 20.


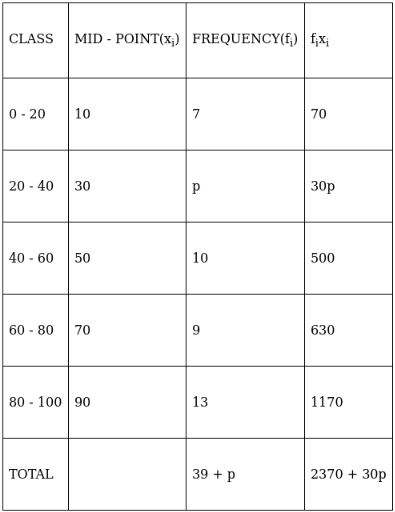
Q.10. If the mean of the following frequency distribution is 54, find the value of p.
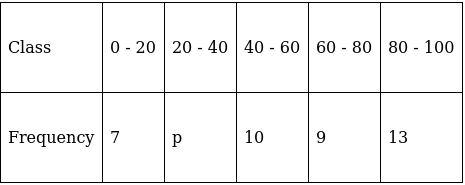
RS Aggarwal Solutions: Mean, Median, Mode of Grouped Data, Cumulative Frequency Graph and Ogive- 1 | RS Aggarwal Solutions for Class 10 Mathematics

For equal class intervals, we will solve by finding mid points of these classes using direct method.
RS Aggarwal Solutions: Mean, Median, Mode of Grouped Data, Cumulative Frequency Graph and Ogive- 1 | RS Aggarwal Solutions for Class 10 Mathematics
We have got
Σfi = 39 + p and Σfixi = 2370 + 30p 
∵ mean is given by
RS Aggarwal Solutions: Mean, Median, Mode of Grouped Data, Cumulative Frequency Graph and Ogive- 1 | RS Aggarwal Solutions for Class 10 Mathematics
RS Aggarwal Solutions: Mean, Median, Mode of Grouped Data, Cumulative Frequency Graph and Ogive- 1 | RS Aggarwal Solutions for Class 10 Mathematics (∵ given: mean of pocket allowance is 54)
⇒ 2106 + 54p = 2370 + 30p
⇒ 54p – 30p = 2370 – 2106
⇒ 24p = 264
⇒ p = 11
Thus, p is 11.


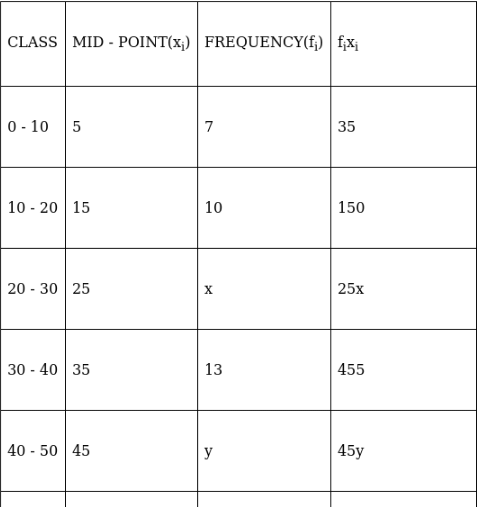
Q.11. The mean of the following data is 42. Find the missing frequencies x and y if the Sum of frequencies is 100.
RS Aggarwal Solutions: Mean, Median, Mode of Grouped Data, Cumulative Frequency Graph and Ogive- 1 | RS Aggarwal Solutions for Class 10 Mathematics

For equal class intervals, we will solve by finding mid points of these classes using direct method.
RS Aggarwal Solutions: Mean, Median, Mode of Grouped Data, Cumulative Frequency Graph and Ogive- 1 | RS Aggarwal Solutions for Class 10 Mathematics
We have got
Σfi = 63 + x + y and Σfixi = 2775 + 25x + 45y 
∵ mean is given by
RS Aggarwal Solutions: Mean, Median, Mode of Grouped Data, Cumulative Frequency Graph and Ogive- 1 | RS Aggarwal Solutions for Class 10 Mathematics
RS Aggarwal Solutions: Mean, Median, Mode of Grouped Data, Cumulative Frequency Graph and Ogive- 1 | RS Aggarwal Solutions for Class 10 Mathematics (∵ given: mean of pocket allowance is 42)
⇒ 2646 + 42x + 42y = 2775 + 25x + 45y
⇒ 42x – 25x + 42y – 45y = 2775 – 2646
⇒ 17x – 3y = 129 …(i)
As given in the question, frequency(Σfi) = 100
And as calculated by us, frequency (Σfi) = 63 + x + y
Equalizing them, we get
63 + x + y = 100
⇒ x + y = 37 …(ii)
We will now solve equations (i) and (ii), multiply eq.(ii) by 3 and then add it to eq.(i), we get
(17x – 3y) + [3(x + y)] = 129 + 111
⇒ 17x – 3y + 3x + 3y = 240
⇒ 20x = 240
⇒ x = 12
Substitute x = 12 in equation (ii),
12 + y = 37
⇒ y = 37 – 12
⇒ y = 25
Thus, x = 12 and y = 25.


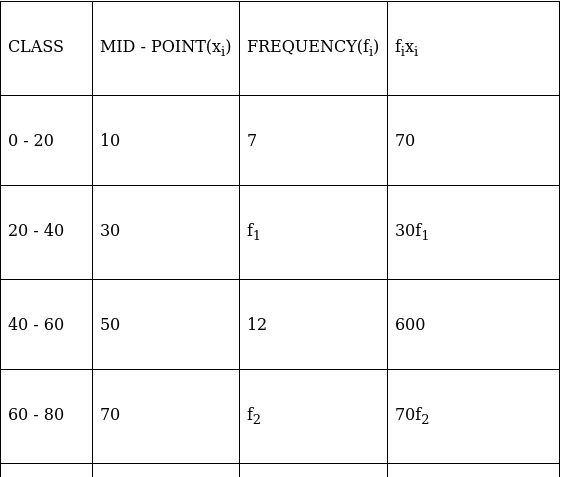
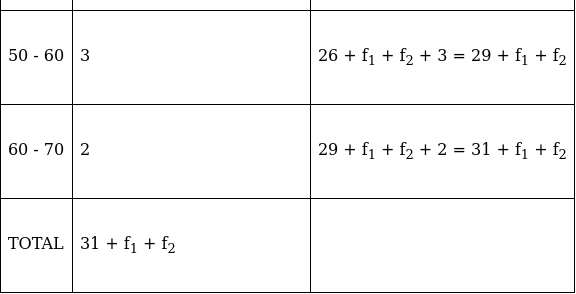
Q.12. The daily expenditure of 100 families are given below. Calculate f1 and f2 if the mean daily expenditure is Rs.188.
RS Aggarwal Solutions: Mean, Median, Mode of Grouped Data, Cumulative Frequency Graph and Ogive- 1 | RS Aggarwal Solutions for Class 10 Mathematics

For equal class intervals, we will solve by finding mid points of these classes using direct method.
RS Aggarwal Solutions: Mean, Median, Mode of Grouped Data, Cumulative Frequency Graph and Ogive- 1 | RS Aggarwal Solutions for Class 10 Mathematics
We have got
Σfi = 35 + f1 + f2 and Σfixi = 6150 + 190f1 + 210f2 
∵ mean is given by
RS Aggarwal Solutions: Mean, Median, Mode of Grouped Data, Cumulative Frequency Graph and Ogive- 1 | RS Aggarwal Solutions for Class 10 Mathematics
RS Aggarwal Solutions: Mean, Median, Mode of Grouped Data, Cumulative Frequency Graph and Ogive- 1 | RS Aggarwal Solutions for Class 10 Mathematics (∵ given: mean of pocket allowance is 188)
⇒ 6580 + 188f1 + 188f2 = 6150 + 190f1 + 210f2 
⇒ 190f1 – 188f1 + 210f2 – 188f2 = 6580 – 6150 
⇒ 2f1 + 22f2 = 430 …(i) 
As given in the question, frequency(Σfi) = 100 
And as calculated by us, frequency (Σfi) = 35 + f1 + f2 
Comparing them, we get
35 + f1 + f2 = 100 
⇒ f1 + f2 = 65 …(ii) 
We will now solve equations (i) and (ii), multiply eq.(ii) by 2 and then subtracting it from eq.(i), we get 
(2f1 + 22f2) – [2(f1 + f2)] = 430 – 130
⇒ 2f1 + 22f2 – 2f1 – 2f2 = 300
⇒ 20 f2 = 300
⇒ f2 = 15
Substitute f2 = 15 in equation (ii),
f1 + 15 = 65
⇒ f1 = 65 – 15
⇒ f1 = 50
Thus, f1 = 50 and f2 = 15.


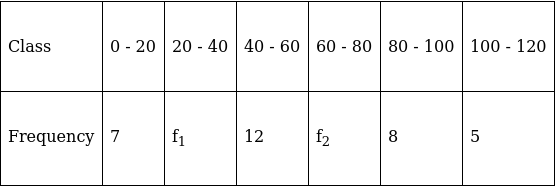
Q.13. The mean of the following frequency distribution is 57.6 and the Total number of observations is 50.
RS Aggarwal Solutions: Mean, Median, Mode of Grouped Data, Cumulative Frequency Graph and Ogive- 1 | RS Aggarwal Solutions for Class 10 Mathematics
Find f1 and f2.

For equal class intervals, we will solve by finding mid points of these classes using direct method.
RS Aggarwal Solutions: Mean, Median, Mode of Grouped Data, Cumulative Frequency Graph and Ogive- 1 | RS Aggarwal Solutions for Class 10 Mathematics
We have got
Σfi = 32 + f1 + f2 and Σfixi = 1940 + 30f1 + 70f2 
∵ mean is given by
RS Aggarwal Solutions: Mean, Median, Mode of Grouped Data, Cumulative Frequency Graph and Ogive- 1 | RS Aggarwal Solutions for Class 10 Mathematics
RS Aggarwal Solutions: Mean, Median, Mode of Grouped Data, Cumulative Frequency Graph and Ogive- 1 | RS Aggarwal Solutions for Class 10 Mathematics (∵ given: mean of pocket allowance is 57.6)
⇒ 1843.2 + 57.6f1 + 57.6f2 = 1940 + 30f1 + 70f2 
⇒ 57.6f1 – 30f1 + 57.6f2 – 70f2 = 1940 – 1843.2 
⇒ 27.6f1 – 12.4f2 = 96.8 
⇒ 69f1 – 31f2 = 242 …(i) 
As given in the question, frequency(Σfi) = 50 
And as calculated by us, frequency (Σfi) = 32 + f1 + f2 
Comparing them, we get
32 + f1 + f2 = 50 
⇒ f1 + f2 = 18 …(ii) 
We will now solve equations (i) and (ii), multiply eq.(ii) by 31 and then adding to eq.(i), we get
(69f1 – 31f2) + [31(f1 + f2)] = 242 + 558
⇒ 69f1 – 31f2 + 31f1 + 31f2 = 800
⇒ 100f1 = 800
⇒ f1 = 8
Substitute f1 = 8 in equation (ii),
8 + f2 = 18
⇒ f2 = 18 – 8
⇒ f2 = 10
Thus, f1 = 8 and f2 = 10.


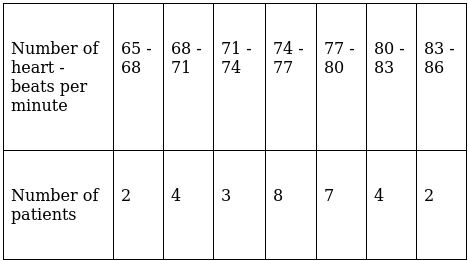
Q.14. During a medical check - up, the number of heart beats per minute of 30 patients were recorded and Summarized as follows:
RS Aggarwal Solutions: Mean, Median, Mode of Grouped Data, Cumulative Frequency Graph and Ogive- 1 | RS Aggarwal Solutions for Class 10 Mathematics
Find the mean heartbeats per minute for these patients, choosing a suitable method.

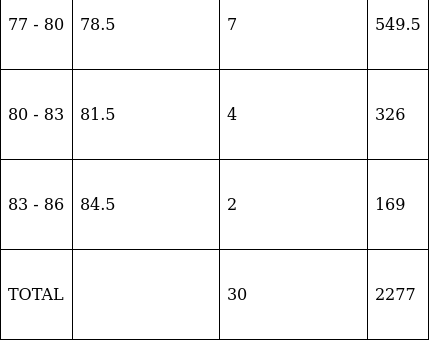
We will find the mean heartbeats per minute by direct method.
RS Aggarwal Solutions: Mean, Median, Mode of Grouped Data, Cumulative Frequency Graph and Ogive- 1 | RS Aggarwal Solutions for Class 10 Mathematics
We have got
Σfi = 30 & Σfixi = 2277 
∵ mean is given by
RS Aggarwal Solutions: Mean, Median, Mode of Grouped Data, Cumulative Frequency Graph and Ogive- 1 | RS Aggarwal Solutions for Class 10 Mathematics
RS Aggarwal Solutions: Mean, Median, Mode of Grouped Data, Cumulative Frequency Graph and Ogive- 1 | RS Aggarwal Solutions for Class 10 Mathematics = 75.9
Thus, mean is 75.9 heartbeats per minute.


Q.15. Find the mean marks per student, using Assumed - mean method:
RS Aggarwal Solutions: Mean, Median, Mode of Grouped Data, Cumulative Frequency Graph and Ogive- 1 | RS Aggarwal Solutions for Class 10 Mathematics

We will find the mean marks per student using Assumed - mean method, where A = Assumed mean. 
RS Aggarwal Solutions: Mean, Median, Mode of Grouped Data, Cumulative Frequency Graph and Ogive- 1 | RS Aggarwal Solutions for Class 10 Mathematics
We have got
A = 25, Σfi = 100 & Σfidi = 300 
∵ mean is given by
RS Aggarwal Solutions: Mean, Median, Mode of Grouped Data, Cumulative Frequency Graph and Ogive- 1 | RS Aggarwal Solutions for Class 10 Mathematics
RS Aggarwal Solutions: Mean, Median, Mode of Grouped Data, Cumulative Frequency Graph and Ogive- 1 | RS Aggarwal Solutions for Class 10 Mathematics = 28
Thus, mean is 28. 


Q.16. Find the mean of the following frequency distribution, using the Assumed - mean method:
RS Aggarwal Solutions: Mean, Median, Mode of Grouped Data, Cumulative Frequency Graph and Ogive- 1 | RS Aggarwal Solutions for Class 10 Mathematics

We will find the mean of the frequency distribution using Assumed - mean method, where A = Assumed mean.
RS Aggarwal Solutions: Mean, Median, Mode of Grouped Data, Cumulative Frequency Graph and Ogive- 1 | RS Aggarwal Solutions for Class 10 Mathematics
We have got
A = 150, Σfi = 80 & Σfidi = - 300 
∵ mean is given by
RS Aggarwal Solutions: Mean, Median, Mode of Grouped Data, Cumulative Frequency Graph and Ogive- 1 | RS Aggarwal Solutions for Class 10 Mathematics
RS Aggarwal Solutions: Mean, Median, Mode of Grouped Data, Cumulative Frequency Graph and Ogive- 1 | RS Aggarwal Solutions for Class 10 Mathematics = 146.25
Thus, mean is 146.25.


Q.17. Find the mean of the following data, using the Assumed - mean method:
RS Aggarwal Solutions: Mean, Median, Mode of Grouped Data, Cumulative Frequency Graph and Ogive- 1 | RS Aggarwal Solutions for Class 10 Mathematics

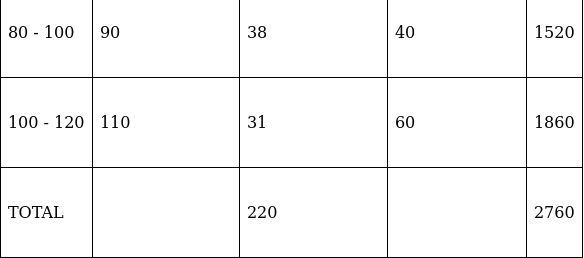
We will find the mean of the data using Assumed - mean method, where A = Assumed mean.
RS Aggarwal Solutions: Mean, Median, Mode of Grouped Data, Cumulative Frequency Graph and Ogive- 1 | RS Aggarwal Solutions for Class 10 Mathematics
We have got
A = 50, Σfi = 220 & Σfidi = 2760 
∵ mean is given by
RS Aggarwal Solutions: Mean, Median, Mode of Grouped Data, Cumulative Frequency Graph and Ogive- 1 | RS Aggarwal Solutions for Class 10 Mathematics
RS Aggarwal Solutions: Mean, Median, Mode of Grouped Data, Cumulative Frequency Graph and Ogive- 1 | RS Aggarwal Solutions for Class 10 Mathematics = 62.55
Thus, mean is 62.55.


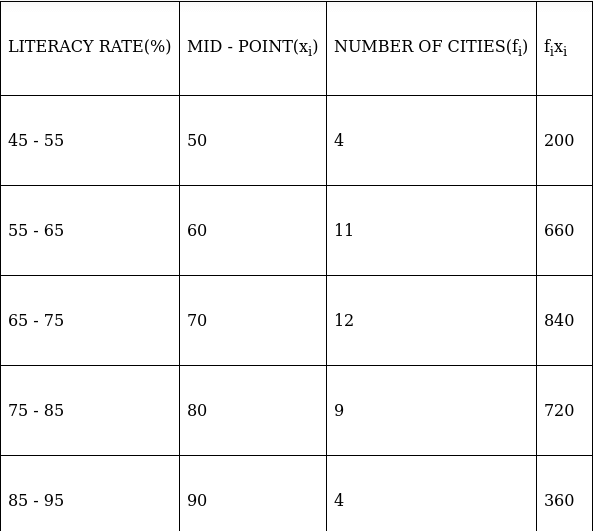
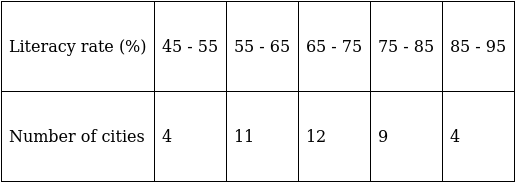
Q.18. The following table gives the literacy rate (in percentage) in 40 cities. Find the mean literacy rate, choosing a suitable method.
RS Aggarwal Solutions: Mean, Median, Mode of Grouped Data, Cumulative Frequency Graph and Ogive- 1 | RS Aggarwal Solutions for Class 10 Mathematics

We will solve this using direct method.
RS Aggarwal Solutions: Mean, Median, Mode of Grouped Data, Cumulative Frequency Graph and Ogive- 1 | RS Aggarwal Solutions for Class 10 Mathematics
We have got
Σfi = 40 and Σfixi = 2780 
∵ mean is given by
RS Aggarwal Solutions: Mean, Median, Mode of Grouped Data, Cumulative Frequency Graph and Ogive- 1 | RS Aggarwal Solutions for Class 10 Mathematics
RS Aggarwal Solutions: Mean, Median, Mode of Grouped Data, Cumulative Frequency Graph and Ogive- 1 | RS Aggarwal Solutions for Class 10 Mathematics = 69.5
Thus, mean is 69.5%.


Q.19. Find the mean of the following frequency distribution using step - deviation method.
RS Aggarwal Solutions: Mean, Median, Mode of Grouped Data, Cumulative Frequency Graph and Ogive- 1 | RS Aggarwal Solutions for Class 10 Mathematics

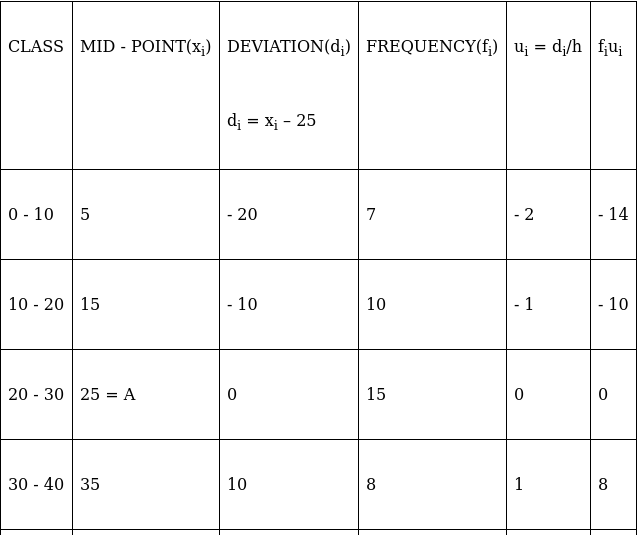
We will find the mean of the frequency distribution using step - deviation method, where A = Assumed mean and h = length of class interval.
Here, let A = 25 and h = 10
RS Aggarwal Solutions: Mean, Median, Mode of Grouped Data, Cumulative Frequency Graph and Ogive- 1 | RS Aggarwal Solutions for Class 10 Mathematics
We have got
A = 25, h = 10, Σfi = 50 & Σfiui = 4 
∵ mean is given by
RS Aggarwal Solutions: Mean, Median, Mode of Grouped Data, Cumulative Frequency Graph and Ogive- 1 | RS Aggarwal Solutions for Class 10 Mathematics
RS Aggarwal Solutions: Mean, Median, Mode of Grouped Data, Cumulative Frequency Graph and Ogive- 1 | RS Aggarwal Solutions for Class 10 Mathematics = 25.8
Thus, mean is 25.8.


Q.20. Find the mean of the following data, using step - deviation method:
RS Aggarwal Solutions: Mean, Median, Mode of Grouped Data, Cumulative Frequency Graph and Ogive- 1 | RS Aggarwal Solutions for Class 10 Mathematics

We will find the mean of the data using step - deviation method, where A = Assumed mean and h = length of class interval.
Here, let A = 40 and h = 10
RS Aggarwal Solutions: Mean, Median, Mode of Grouped Data, Cumulative Frequency Graph and Ogive- 1 | RS Aggarwal Solutions for Class 10 Mathematics
We have got
A = 40, h = 10, Σfi = 86 & Σfiui = 7 
∵ mean is given by
RS Aggarwal Solutions: Mean, Median, Mode of Grouped Data, Cumulative Frequency Graph and Ogive- 1 | RS Aggarwal Solutions for Class 10 Mathematics
RS Aggarwal Solutions: Mean, Median, Mode of Grouped Data, Cumulative Frequency Graph and Ogive- 1 | RS Aggarwal Solutions for Class 10 Mathematics = 40.81
Thus, mean is 40.81.


Q.21. The weights of tea in 70 packets are shown in the following table:
RS Aggarwal Solutions: Mean, Median, Mode of Grouped Data, Cumulative Frequency Graph and Ogive- 1 | RS Aggarwal Solutions for Class 10 Mathematics
Find the mean weight of packets using step - deviation method.

We will find the mean weight of packet using step - deviation method, where A = Assumed mean and h = length of class interval.
Here, let A = 202.5 and h = 1
RS Aggarwal Solutions: Mean, Median, Mode of Grouped Data, Cumulative Frequency Graph and Ogive- 1 | RS Aggarwal Solutions for Class 10 Mathematics
We have got
A = 202.5, h = 1, Σfi = 70 & Σfiui = - 38 
∵ mean is given by
RS Aggarwal Solutions: Mean, Median, Mode of Grouped Data, Cumulative Frequency Graph and Ogive- 1 | RS Aggarwal Solutions for Class 10 Mathematics
RS Aggarwal Solutions: Mean, Median, Mode of Grouped Data, Cumulative Frequency Graph and Ogive- 1 | RS Aggarwal Solutions for Class 10 Mathematics = 201.96
Thus, mean is 201.96 g.


Q.22. Find the mean of the following frequency distribution using a suitable method:
RS Aggarwal Solutions: Mean, Median, Mode of Grouped Data, Cumulative Frequency Graph and Ogive- 1 | RS Aggarwal Solutions for Class 10 Mathematics

We will find the mean of the frequency distribution using step - deviation method, where A = Assumed mean and h = length of class interval.
Here, let A = 45 and h = 10
RS Aggarwal Solutions: Mean, Median, Mode of Grouped Data, Cumulative Frequency Graph and Ogive- 1 | RS Aggarwal Solutions for Class 10 Mathematics
We have got
A = 45, h = 10, Σfi = 150 & Σfiui = - 37 
∵ mean is given by
RS Aggarwal Solutions: Mean, Median, Mode of Grouped Data, Cumulative Frequency Graph and Ogive- 1 | RS Aggarwal Solutions for Class 10 Mathematics
RS Aggarwal Solutions: Mean, Median, Mode of Grouped Data, Cumulative Frequency Graph and Ogive- 1 | RS Aggarwal Solutions for Class 10 Mathematics = 42.53
Thus, mean is 42.53.


Q.23. In an annual examination, marks (out of 90) obtained by students of Class X in mathematics are given below:
RS Aggarwal Solutions: Mean, Median, Mode of Grouped Data, Cumulative Frequency Graph and Ogive- 1 | RS Aggarwal Solutions for Class 10 Mathematics
Find the mean marks.

We will find the mean marks using step - deviation method, where A = Assumed mean and h = length of class interval.
Here, let A = 37.5 and h = 15
RS Aggarwal Solutions: Mean, Median, Mode of Grouped Data, Cumulative Frequency Graph and Ogive- 1 | RS Aggarwal Solutions for Class 10 Mathematics
We have got
A = 37.5, h = 15, Σfi = 50 & Σfiui = 60 
∵ mean is given by
RS Aggarwal Solutions: Mean, Median, Mode of Grouped Data, Cumulative Frequency Graph and Ogive- 1 | RS Aggarwal Solutions for Class 10 Mathematics
RS Aggarwal Solutions: Mean, Median, Mode of Grouped Data, Cumulative Frequency Graph and Ogive- 1 | RS Aggarwal Solutions for Class 10 Mathematics = 55.5
Thus, mean marks are 55.5.


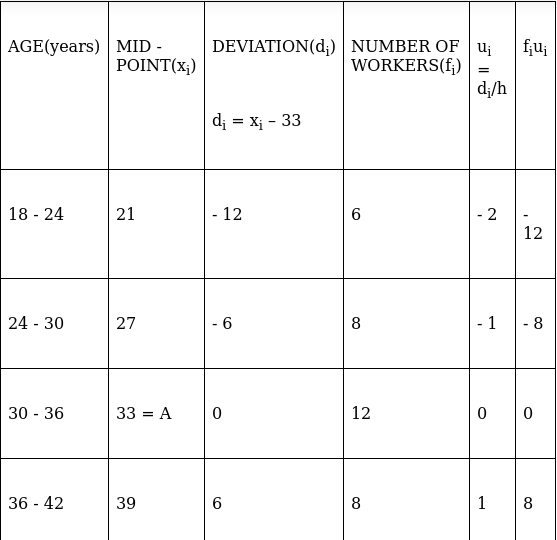
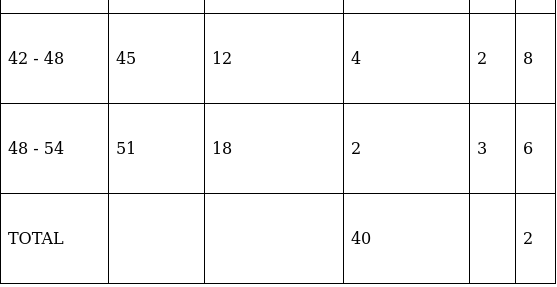
Q.24. Find the arithmetic mean of the following frequency distribution using step - deviation method:
RS Aggarwal Solutions: Mean, Median, Mode of Grouped Data, Cumulative Frequency Graph and Ogive- 1 | RS Aggarwal Solutions for Class 10 Mathematics

We will find the mean of the frequency distribution using step - deviation method, where A = Assumed mean and h = length of class interval.
Here, let A = 33 and h = 6
RS Aggarwal Solutions: Mean, Median, Mode of Grouped Data, Cumulative Frequency Graph and Ogive- 1 | RS Aggarwal Solutions for Class 10 Mathematics
We have got
A = 33, h = 6, Σfi = 40 & Σfiui = 2 
∵ mean is given by
RS Aggarwal Solutions: Mean, Median, Mode of Grouped Data, Cumulative Frequency Graph and Ogive- 1 | RS Aggarwal Solutions for Class 10 Mathematics
RS Aggarwal Solutions: Mean, Median, Mode of Grouped Data, Cumulative Frequency Graph and Ogive- 1 | RS Aggarwal Solutions for Class 10 Mathematics = 33.3
Thus, mean age is 33.3 years.


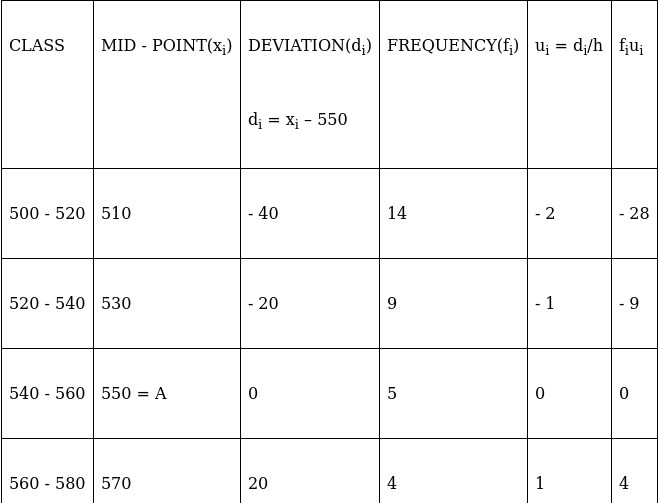
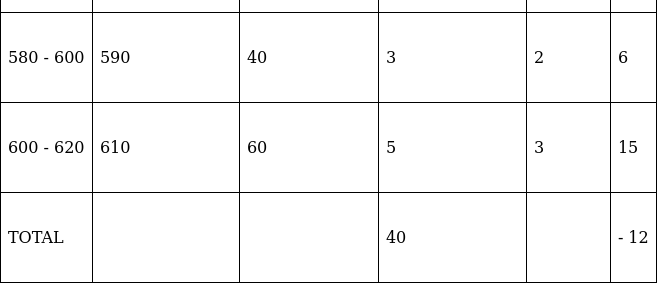
Q.25. Find the mean of the following data using step - deviation method:
RS Aggarwal Solutions: Mean, Median, Mode of Grouped Data, Cumulative Frequency Graph and Ogive- 1 | RS Aggarwal Solutions for Class 10 Mathematics

We will find the mean of the frequency distribution using step - deviation method, where A = Assumed mean and h = length of class interval.
Here, let A = 550 and h = 20
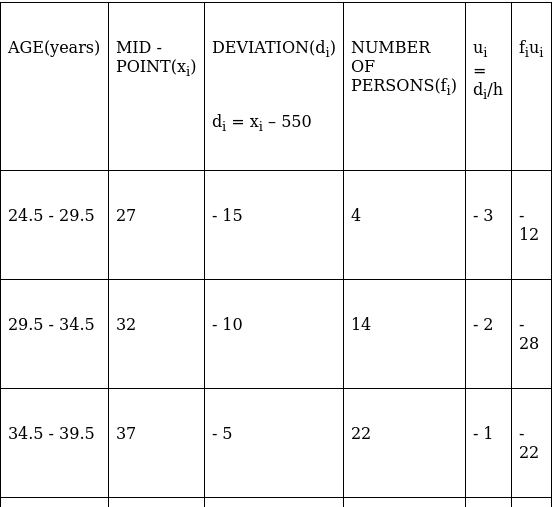
RS Aggarwal Solutions: Mean, Median, Mode of Grouped Data, Cumulative Frequency Graph and Ogive- 1 | RS Aggarwal Solutions for Class 10 Mathematics
We have got
A = 550, h = 20, Σfi = 40 & Σfiui = - 12 
∵ mean is given by
RS Aggarwal Solutions: Mean, Median, Mode of Grouped Data, Cumulative Frequency Graph and Ogive- 1 | RS Aggarwal Solutions for Class 10 Mathematics
RS Aggarwal Solutions: Mean, Median, Mode of Grouped Data, Cumulative Frequency Graph and Ogive- 1 | RS Aggarwal Solutions for Class 10 Mathematics = 544
Thus, mean is 544.


Q.26. Find the mean age from the following frequency distribution:
RS Aggarwal Solutions: Mean, Median, Mode of Grouped Data, Cumulative Frequency Graph and Ogive- 1 | RS Aggarwal Solutions for Class 10 Mathematics

We will find the mean age using step - deviation method, where A = Assumed mean and h = length of class interval.
Here, let A = 42 and h = 5
Since, the class intervals are inclusive type, we’ll first convert it into exclusive type by extending the class interval from both the ends.
RS Aggarwal Solutions: Mean, Median, Mode of Grouped Data, Cumulative Frequency Graph and Ogive- 1 | RS Aggarwal Solutions for Class 10 Mathematics
We have got
A = 42, h = 5, Σfi = 70 & Σfiui = - 37 
∵ mean is given by
RS Aggarwal Solutions: Mean, Median, Mode of Grouped Data, Cumulative Frequency Graph and Ogive- 1 | RS Aggarwal Solutions for Class 10 Mathematics
RS Aggarwal Solutions: Mean, Median, Mode of Grouped Data, Cumulative Frequency Graph and Ogive- 1 | RS Aggarwal Solutions for Class 10 Mathematics = 39.36
Thus, mean age is 544 years.


Q.27. The following table shows the age distribution of patients of malaria in a village during a particular month:
RS Aggarwal Solutions: Mean, Median, Mode of Grouped Data, Cumulative Frequency Graph and Ogive- 1 | RS Aggarwal Solutions for Class 10 Mathematics
Find the average age of the patients.

We will find the average age using step - deviation method, where A = Assumed mean and h = length of class interval.
Here, let A = 29.5 and h = 10
Since, the class intervals are inclusive type, we’ll first convert it into exclusive type by extending the class interval from both the ends.
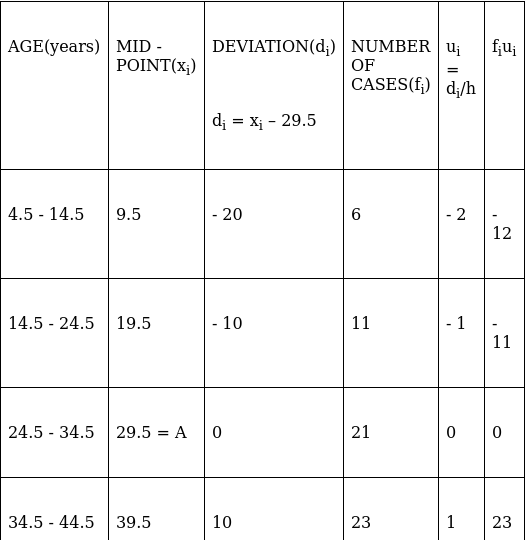
RS Aggarwal Solutions: Mean, Median, Mode of Grouped Data, Cumulative Frequency Graph and Ogive- 1 | RS Aggarwal Solutions for Class 10 Mathematics
We have got
A = 29.5, h = 10, Σfi = 80 & Σfiui = 43 
∵ mean is given by
RS Aggarwal Solutions: Mean, Median, Mode of Grouped Data, Cumulative Frequency Graph and Ogive- 1 | RS Aggarwal Solutions for Class 10 Mathematics
RS Aggarwal Solutions: Mean, Median, Mode of Grouped Data, Cumulative Frequency Graph and Ogive- 1 | RS Aggarwal Solutions for Class 10 Mathematics = 34.88
Thus, mean age is 34.88 years.


Q.28. Weight of 60 eggs were recorded as given below:
RS Aggarwal Solutions: Mean, Median, Mode of Grouped Data, Cumulative Frequency Graph and Ogive- 1 | RS Aggarwal Solutions for Class 10 Mathematics
Calculate their mean weight to the nearest gram.

We will find the mean weight using step - deviation method, where A = Assumed mean and h = length of class interval.
Here, let A = 92 and h = 5
Since, the class intervals are inclusive type, we’ll first convert it into exclusive type by extending the class interval from both the ends.
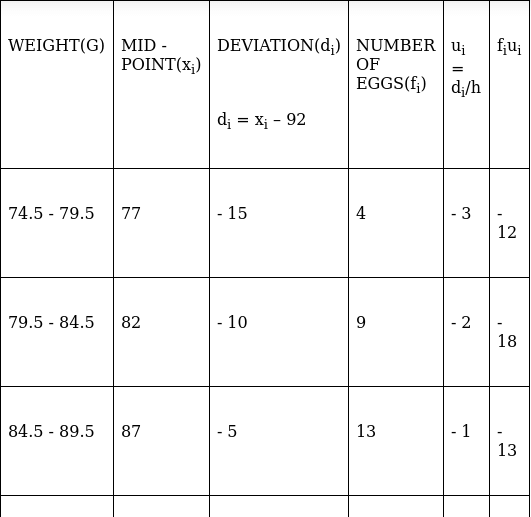
RS Aggarwal Solutions: Mean, Median, Mode of Grouped Data, Cumulative Frequency Graph and Ogive- 1 | RS Aggarwal Solutions for Class 10 Mathematics
We have got
A = 92, h = 5, Σfi = 60 & Σfiui = - 19 
∵ mean is given by
RS Aggarwal Solutions: Mean, Median, Mode of Grouped Data, Cumulative Frequency Graph and Ogive- 1 | RS Aggarwal Solutions for Class 10 Mathematics
RS Aggarwal Solutions: Mean, Median, Mode of Grouped Data, Cumulative Frequency Graph and Ogive- 1 | RS Aggarwal Solutions for Class 10 Mathematics = 90.42
Thus, mean weight is 90 g.


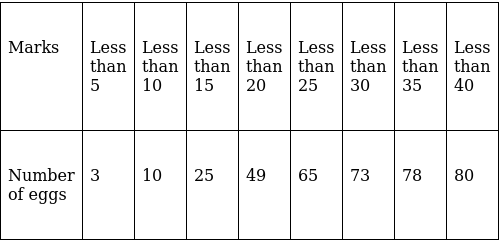
Q.29. The following table shows the marks scored by 80 students in an examination:
RS Aggarwal Solutions: Mean, Median, Mode of Grouped Data, Cumulative Frequency Graph and Ogive- 1 | RS Aggarwal Solutions for Class 10 Mathematics
Calculate the mean marks correct to 2 decimal places.

We will find the mean marks using step - deviation method, where A = Assumed mean and h = length of class interval.
Here, let A = 17.5 and h = 5
Since, the class intervals are less - than type, we’ll first convert it into exclusive type.
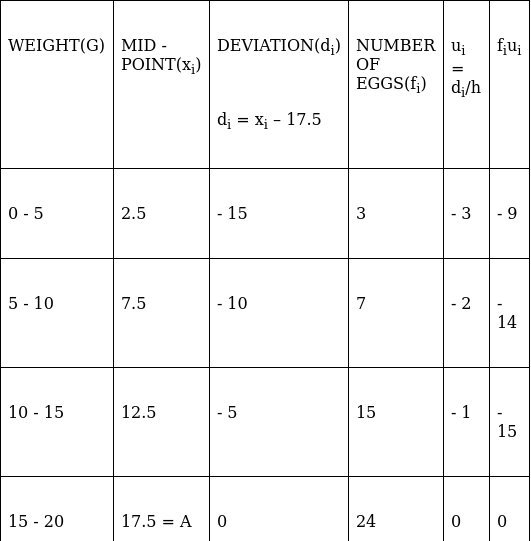
RS Aggarwal Solutions: Mean, Median, Mode of Grouped Data, Cumulative Frequency Graph and Ogive- 1 | RS Aggarwal Solutions for Class 10 Mathematics
We have got
A = 17.5, h = 5, Σfi = 80 & Σfiui = 17 
∵ mean is given by
RS Aggarwal Solutions: Mean, Median, Mode of Grouped Data, Cumulative Frequency Graph and Ogive- 1 | RS Aggarwal Solutions for Class 10 Mathematics
RS Aggarwal Solutions: Mean, Median, Mode of Grouped Data, Cumulative Frequency Graph and Ogive- 1 | RS Aggarwal Solutions for Class 10 Mathematics = 18.5625
Thus, mean marks correct to 2 decimal places are 18.56.


Exercise 9b

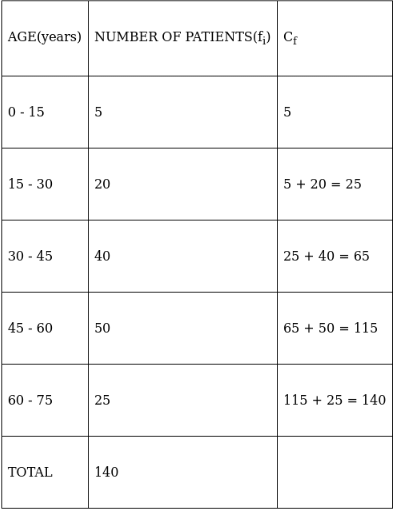
Q.1. In a hospital, the ages of diabetic patients were recorded as follows. Find the median age.
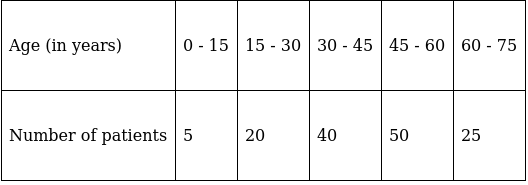
RS Aggarwal Solutions: Mean, Median, Mode of Grouped Data, Cumulative Frequency Graph and Ogive- 1 | RS Aggarwal Solutions for Class 10 Mathematics

To find median,
Assume Σfi = N = Sum of frequencies,
h = length of median class,
l = lower boundary of the median class,
f = frequency of median class
and Cf = cumulative frequency
Lets form a table.
RS Aggarwal Solutions: Mean, Median, Mode of Grouped Data, Cumulative Frequency Graph and Ogive- 1 | RS Aggarwal Solutions for Class 10 Mathematics
So, N = 140
⇒ N/2 = 140/2 = 70
The cumulative frequency just greater than (N/2 = ) 70 is 115, so the corresponding median class is 45 - 60 and accordingly we get Cf = 65(cumulative frequency before the median class).
Now, since median class is 45 - 60.
∴ l = 45, h = 15, f = 50, N/2 = 70 and Cf = 65
Median is given by,
RS Aggarwal Solutions: Mean, Median, Mode of Grouped Data, Cumulative Frequency Graph and Ogive- 1 | RS Aggarwal Solutions for Class 10 Mathematics
= 45 + 1.5
= 46.5
Thus, median age is 46.5 years.


Q.2. Compute the median from the following data:
RS Aggarwal Solutions: Mean, Median, Mode of Grouped Data, Cumulative Frequency Graph and Ogive- 1 | RS Aggarwal Solutions for Class 10 Mathematics

To find median,
Assume Σfi = N = Sum of frequencies,
h = length of median class,
l = lower boundary of the median class,
f = frequency of median class
and C= cumulative frequency
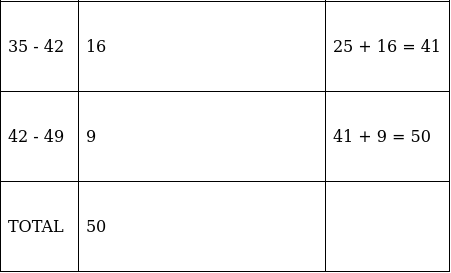
Lets form a table.
RS Aggarwal Solutions: Mean, Median, Mode of Grouped Data, Cumulative Frequency Graph and Ogive- 1 | RS Aggarwal Solutions for Class 10 Mathematics
So, N = 50
⇒ N/2 = 50/2 = 25
The cumulative frequency just greater than (N/2 = ) 25 is 41, so the corresponding median class is 35 - 42 and accordingly we get Cf = 25(cumulative frequency before the median class).
Now, since median class is 35 - 42.
∴ l = 35, h = 7, f = 16, N/2 = 25 and Cf = 25
Median is given by,
RS Aggarwal Solutions: Mean, Median, Mode of Grouped Data, Cumulative Frequency Graph and Ogive- 1 | RS Aggarwal Solutions for Class 10 Mathematics
= 35 + 0
= 35
Thus, median marks are 35.


Q.3. The following table shows the daily wages of workers in a factory:
RS Aggarwal Solutions: Mean, Median, Mode of Grouped Data, Cumulative Frequency Graph and Ogive- 1 | RS Aggarwal Solutions for Class 10 Mathematics
Find the median daily wage income of the workers.

To find median,
Assume Σfi = N = Sum of frequencies,
h = length of median class,
l = lower boundary of the median class,
f = frequency of median class
and Cf = cumulative frequency
Lets form a table.
RS Aggarwal Solutions: Mean, Median, Mode of Grouped Data, Cumulative Frequency Graph and Ogive- 1 | RS Aggarwal Solutions for Class 10 Mathematics
So, N = 150
⇒ N/2 = 150/2 = 75
The cumulative frequency just greater than (N/2 = ) 75 is 120, so the corresponding median class is 200 - 300 and accordingly we get Cf = 72(cumulative frequency before the median class).
Now, since median class is 200 - 300.
∴ l = 200, h = 100, f = 48, N/2 = 75 and C= 72
Median is given by,
RS Aggarwal Solutions: Mean, Median, Mode of Grouped Data, Cumulative Frequency Graph and Ogive- 1 | RS Aggarwal Solutions for Class 10 Mathematics
= 200 + 6.25
= 206.25
Thus, median wage is Rs. 206.25.


Q.4. Calculate the median from the following frequency distribution:
RS Aggarwal Solutions: Mean, Median, Mode of Grouped Data, Cumulative Frequency Graph and Ogive- 1 | RS Aggarwal Solutions for Class 10 Mathematics

To find median, Assume
Σfi = N = Sum of frequencies,
h = length of median class,
l = lower boundary of the median class,
f = frequency of median class
and Cf = cumulative frequency
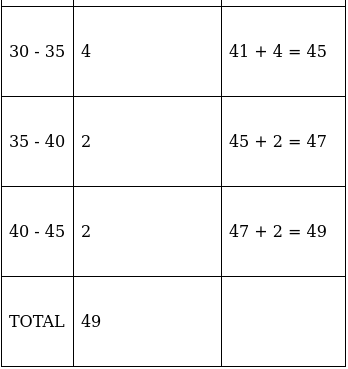
Lets form a table.
RS Aggarwal Solutions: Mean, Median, Mode of Grouped Data, Cumulative Frequency Graph and Ogive- 1 | RS Aggarwal Solutions for Class 10 Mathematics
So, N = 49
⇒ N/2 = 49/2 = 24.5
The cumulative frequency just greater than (N/2 = ) 24.5 is 25, so the corresponding median class is 15 - 20 and accordingly we get Cf = 11(cumulative frequency before the median class).
Now, since median class is 15 - 20.
∴ l = 15, h = 5, f = 15, N/2 = 24.5 and C= 11
Median is given by,
RS Aggarwal Solutions: Mean, Median, Mode of Grouped Data, Cumulative Frequency Graph and Ogive- 1 | RS Aggarwal Solutions for Class 10 Mathematics
= 15 + 4.5
= 19.5
Thus, median is 19.5.


Q.5. Given below is the number of units of electricity consumed in a week in a certain locality:
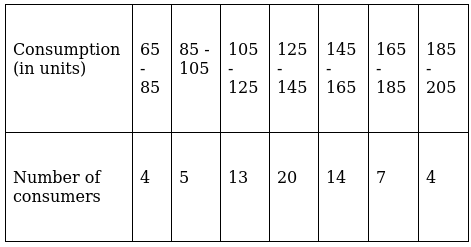
RS Aggarwal Solutions: Mean, Median, Mode of Grouped Data, Cumulative Frequency Graph and Ogive- 1 | RS Aggarwal Solutions for Class 10 Mathematics
Calculate the median.

To find median, Assume
Σfi = N = Sum of frequencies,
h = length of median class,
l = lower boundary of the median class,
f = frequency of median class
and C= cumulative frequency
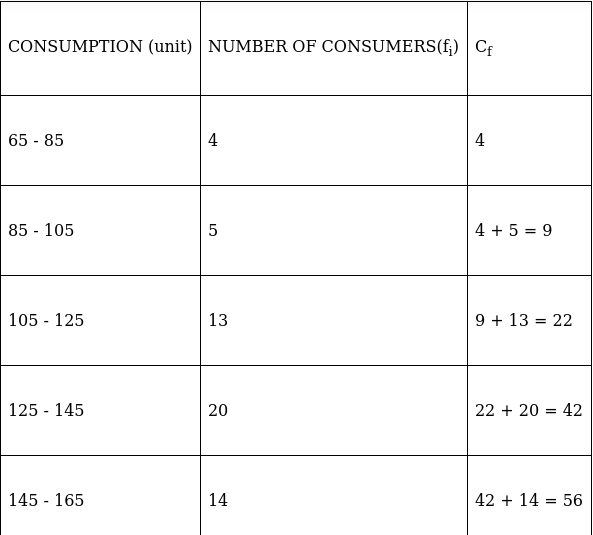
Lets form a table.
RS Aggarwal Solutions: Mean, Median, Mode of Grouped Data, Cumulative Frequency Graph and Ogive- 1 | RS Aggarwal Solutions for Class 10 Mathematics
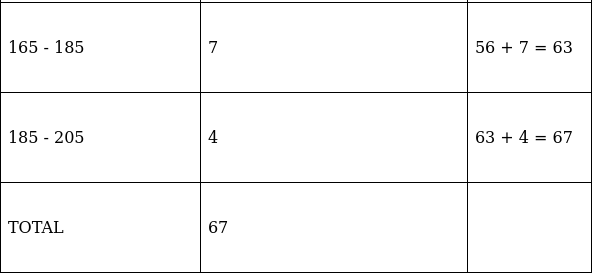
So, N = 67
⇒ N/2 = 67/2 = 33.5
The cumulative frequency just greater than (N/2 = ) 33.5 is 42, so the corresponding median class is 125 - 145 and accordingly we get Cf = 22(cumulative frequency before the median class).
Now, since median class is 125 - 145.
∴ l = 125, h = 20, f = 20, N/2 = 33.5 and Cf = 22
Median is given by,
RS Aggarwal Solutions: Mean, Median, Mode of Grouped Data, Cumulative Frequency Graph and Ogive- 1 | RS Aggarwal Solutions for Class 10 Mathematics
= 125 + 11.5
= 136.5
Thus, median is 136.5.


Q.6. Calculate the median from the following data:
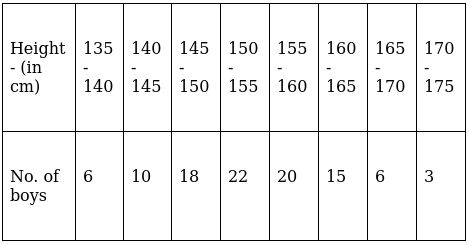
RS Aggarwal Solutions: Mean, Median, Mode of Grouped Data, Cumulative Frequency Graph and Ogive- 1 | RS Aggarwal Solutions for Class 10 Mathematics

To find median, Assume
Σf= N = Sum of frequencies,
h = length of median class,
l = lower boundary of the median class,
f = frequency of median class
and Cf = cumulative frequency
Lets form a table.
RS Aggarwal Solutions: Mean, Median, Mode of Grouped Data, Cumulative Frequency Graph and Ogive- 1 | RS Aggarwal Solutions for Class 10 Mathematics
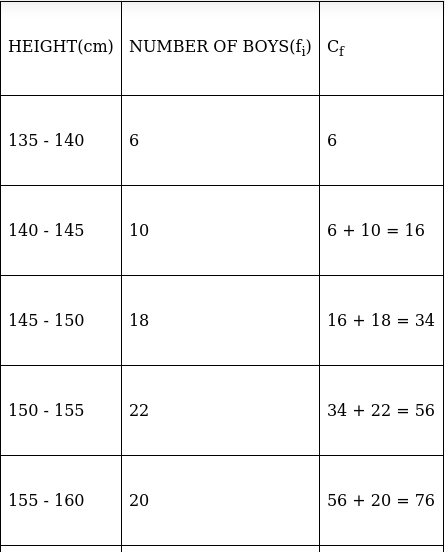
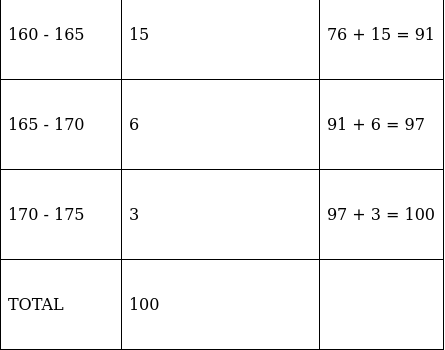
So, N = 100
⇒ N/2 = 100/2 = 50
The cumulative frequency just greater than (N/2 = ) 50 is 56, so the corresponding median class is 150 - 155 and accordingly we get C= 34(cumulative frequency before the median class).
Now, since median class is 150 - 155.
∴ l = 150, h = 5, f = 22, N/2 = 50 and Cf = 34
Median is given by,
RS Aggarwal Solutions: Mean, Median, Mode of Grouped Data, Cumulative Frequency Graph and Ogive- 1 | RS Aggarwal Solutions for Class 10 Mathematics
= 150 + 3.636= 153.64
Thus, median is 153.64 cm.


Q.7. Calculate the missing frequency from the following distribution, it being given that the median of the distribution is 24.
RS Aggarwal Solutions: Mean, Median, Mode of Grouped Data, Cumulative Frequency Graph and Ogive- 1 | RS Aggarwal Solutions for Class 10 Mathematics

Median(given) = 24, Assume
Σf= N = Sum of frequencies,
h = length of median class,
l = lower boundary of the median class,
f = frequency of median class
and Cf = cumulative frequency
Lets form a table, where x is the unknown frequency.
RS Aggarwal Solutions: Mean, Median, Mode of Grouped Data, Cumulative Frequency Graph and Ogive- 1 | RS Aggarwal Solutions for Class 10 Mathematics
Median = 24 (as already mentioned in the question)
24 lies between 20 - 30 ⇒ Median class = 20 - 30
∴ l = 20, h = 10, f = x, N/2 = (55 + x)/2 and Cf = 30
Median is given by,
RS Aggarwal Solutions: Mean, Median, Mode of Grouped Data, Cumulative Frequency Graph and Ogive- 1 | RS Aggarwal Solutions for Class 10 Mathematics
⇒ 24 – 20 = (10x – 50)/2x
⇒ (4)(2x) = 10x – 50
⇒ 8x = 10x – 50
⇒ 10x – 8x = 50
⇒ 2x = 50
⇒ x = 25
Thus, the unknown frequency is 25.


Q.8. The median of the following data is 16. Find the missing frequencies a and b if the Total of frequencies is 70.
RS Aggarwal Solutions: Mean, Median, Mode of Grouped Data, Cumulative Frequency Graph and Ogive- 1 | RS Aggarwal Solutions for Class 10 Mathematics

Given: Median = 16 & N = 70
Assume
Σfi = N = Sum of frequencies,
h = length of median class,
l = lower boundary of the median class,
f = frequency of median class
and Cf = cumulative frequency
Lets form a table, where x is the unknown frequency.
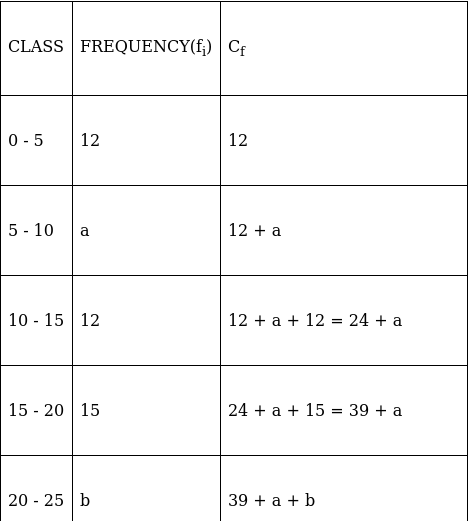
RS Aggarwal Solutions: Mean, Median, Mode of Grouped Data, Cumulative Frequency Graph and Ogive- 1 | RS Aggarwal Solutions for Class 10 Mathematics
Median = 16 (as already mentioned in the question)
16 lies between 15 - 20 ⇒ Median class = 15 - 20
∴ l = 15, h = 5, f = 15, N/2 = (55 + a + b)/2 and C= 24 + a
Median is given by,
RS Aggarwal Solutions: Mean, Median, Mode of Grouped Data, Cumulative Frequency Graph and Ogive- 1 | RS Aggarwal Solutions for Class 10 Mathematics

RS Aggarwal Solutions: Mean, Median, Mode of Grouped Data, Cumulative Frequency Graph and Ogive- 1 | RS Aggarwal Solutions for Class 10 Mathematics
⇒ 16 – 15 = (7 – a + b)/6
⇒ 6 = 7 – a + b
⇒ a – b = 1 …(i)
And given that N = 70
⇒ 55 + a + b = 70
⇒ a + b = 15 …(ii)
Solving equations (i) & (ii), we get
(a – b) + (a + b) = 1 + 15
⇒ 2a = 16
⇒ a = 8
Substituting a = 8 in eq.(i),
8 – b = 1
⇒ b = 7
Thus, the unknown frequencies are a = 8 and b = 7.


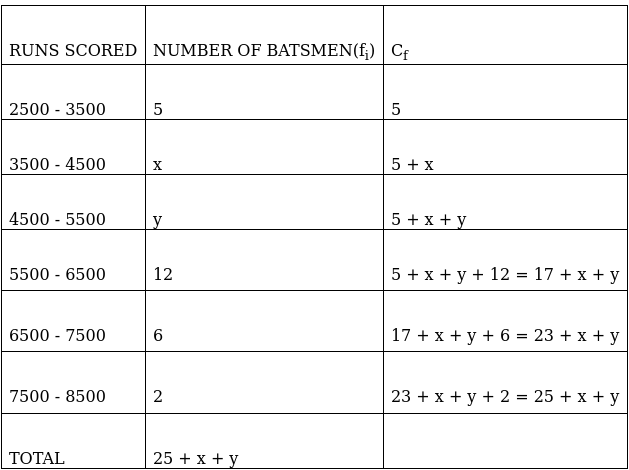
Q.9. In the following data the median of the runs scored by 60 top batsmen of the world in one - day international cricket matches is 5000. Find the missing frequencies x and y.
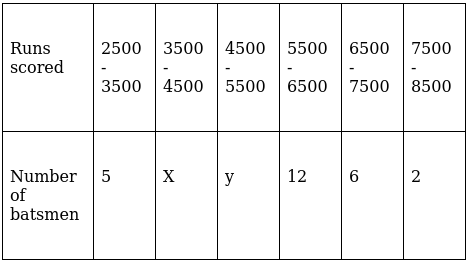
RS Aggarwal Solutions: Mean, Median, Mode of Grouped Data, Cumulative Frequency Graph and Ogive- 1 | RS Aggarwal Solutions for Class 10 Mathematics

Given: Median = 5000 & N = 60
Assume
Σf= N = Sum of frequencies,
h = length of median class,
l = lower boundary of the median class,
f = frequency of median class
and Cf = cumulative frequency
Lets form a table, where x is the unknown frequency.
RS Aggarwal Solutions: Mean, Median, Mode of Grouped Data, Cumulative Frequency Graph and Ogive- 1 | RS Aggarwal Solutions for Class 10 Mathematics
Given,
Median = 5000 (as already mentioned in the question)
Sum of frequencies, N = x + y + 25 = 60 [Total No of players]
5000 lies between 4500 - 5500 ⇒ Median class = 4500 - 5500
∴ l = 4500, h = 1000, f = y, N/2 = 60/2=30
and Cf = 5 + x
Median is given by,
RS Aggarwal Solutions: Mean, Median, Mode of Grouped Data, Cumulative Frequency Graph and Ogive- 1 | RS Aggarwal Solutions for Class 10 Mathematics
⇒ 5000 – 4500 = (25000 – 1000x)/y
⇒ 500y = 25000 – 1000x
⇒ 2x + y = 50 …(i)
And given that N = 60
⇒ 25 + x + y = 60
⇒ x + y = 35 …(ii)
Solving equations (i) & (ii), we get
(2x + y) – (x + y) = 50 – 35
⇒ x = 15
Substituting x = 15 in eq.(ii),
15 + y = 35
⇒ y = 20
Thus, the unknown frequencies are x = 15 and y = 20.


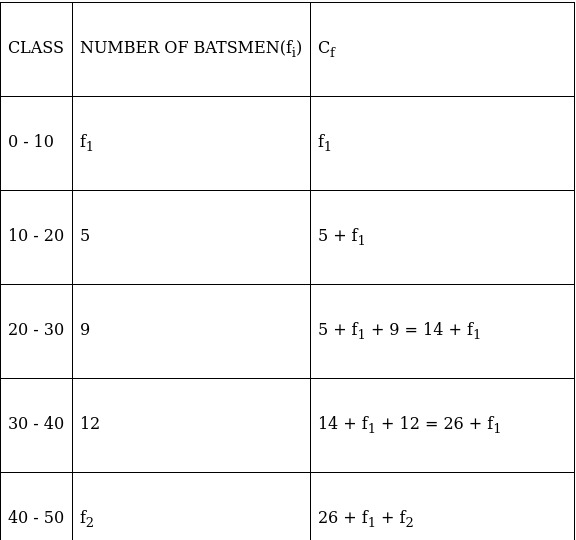
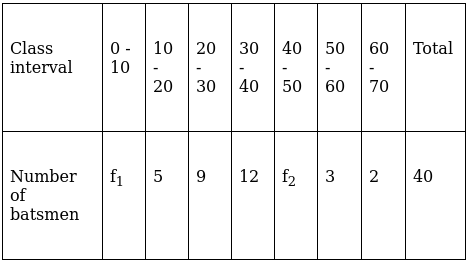
Q.10. If the median of the following frequency distribution is 32.5, find the values of f1 and f2
RS Aggarwal Solutions: Mean, Median, Mode of Grouped Data, Cumulative Frequency Graph and Ogive- 1 | RS Aggarwal Solutions for Class 10 Mathematics

Given: Median = 32.5 & N = 40
Assume
Σfi = N = Sum of frequencies,
h = length of median class,
l = lower boundary of the median class,
f = frequency of median class
and Cf = cumulative frequency
Lets form a table, where x is the unknown frequency.
RS Aggarwal Solutions: Mean, Median, Mode of Grouped Data, Cumulative Frequency Graph and Ogive- 1 | RS Aggarwal Solutions for Class 10 Mathematics
Median = 32.5 (as already mentioned in the question)
32.5 lies between 30 - 40 ⇒ Median class = 30 - 40
∴ l = 30, h = 10, f = 12, N/2 = (31 + f1 + f2)/2 = 40/2 and C= 14 + f1
Median is given by,
RS Aggarwal Solutions: Mean, Median, Mode of Grouped Data, Cumulative Frequency Graph and Ogive- 1 | RS Aggarwal Solutions for Class 10 Mathematics

RS Aggarwal Solutions: Mean, Median, Mode of Grouped Data, Cumulative Frequency Graph and Ogive- 1 | RS Aggarwal Solutions for Class 10 Mathematics
⇒ 32.5 – 30 = (60 – 10f1)/12
⇒ (2.5)(12) = 60 – 10f1
⇒ 30 = 60 – 10f1
⇒ f1 = 3 …(i)
And given that N = 40
⇒ 31 + f1 + f2 = 40
⇒ f+ f2 = 9 …(ii)
Substituting f1 = 3 in eq.(ii),
3 + f2 = 9
⇒ f2 = 6
Thus, the unknown frequencies are f1 = 3 and f2 = 6.


Q.11. Calculate the median for the following data:
RS Aggarwal Solutions: Mean, Median, Mode of Grouped Data, Cumulative Frequency Graph and Ogive- 1 | RS Aggarwal Solutions for Class 10 Mathematics

To find median, Assume
Σfi = N = Sum of frequencies,
h = length of median class,
l = lower boundary of the median class,
f = frequency of median class
and Cf = cumulative frequency
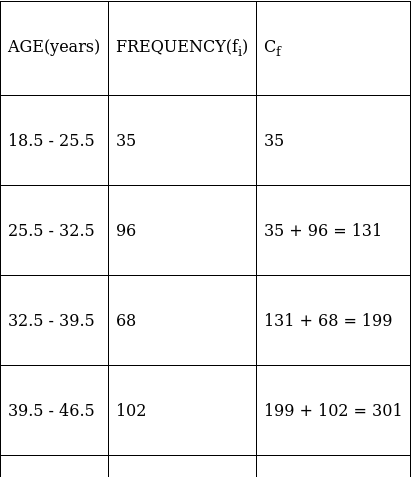
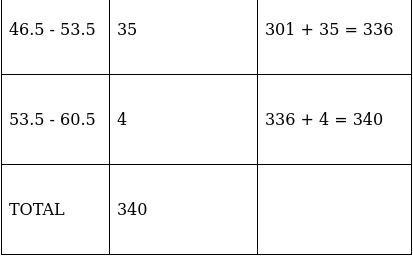
Lets form a table and convert it into exclusive - type by adjusting from both ends of a class.
RS Aggarwal Solutions: Mean, Median, Mode of Grouped Data, Cumulative Frequency Graph and Ogive- 1 | RS Aggarwal Solutions for Class 10 Mathematics
So, N = 340
⇒ N/2 = 340/2 = 170
The cumulative frequency just greater than (N/2 = ) 170 is 199, so the corresponding median class is 32.5 - 39.5 and accordingly we get Cf = 131(cumulative frequency before the median class).
Now, since median class is 32.5 - 39.5.
∴ l = 32.5, h = 7, f = 68, N/2 = 170 and Cf = 131
Median is given by,
RS Aggarwal Solutions: Mean, Median, Mode of Grouped Data, Cumulative Frequency Graph and Ogive- 1 | RS Aggarwal Solutions for Class 10 Mathematics
= 32.5 + 4.014
= 36.51
Thus, median is 36.51 years.


Q.12. Find the median wages for the following frequency distribution:
RS Aggarwal Solutions: Mean, Median, Mode of Grouped Data, Cumulative Frequency Graph and Ogive- 1 | RS Aggarwal Solutions for Class 10 Mathematics

To find median, Assume
Σfi = N = Sum of frequencies,
h = length of median class,
l = lower boundary of the median class,
f = frequency of median class
and Cf = cumulative frequency
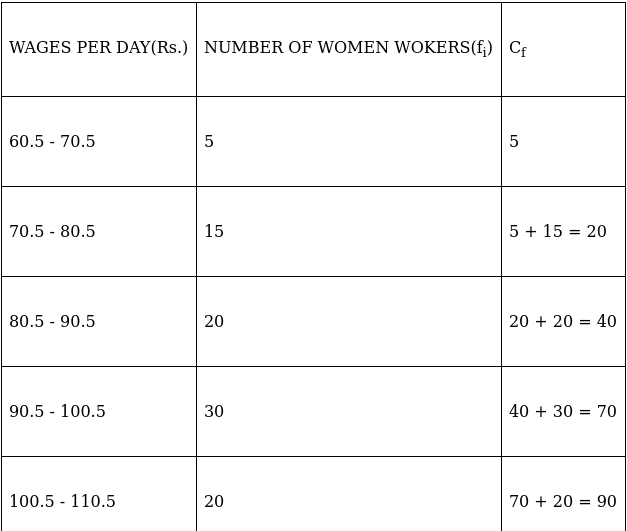
Lets form a table and convert it into exclusive - type by adjusting from both ends of a class.
RS Aggarwal Solutions: Mean, Median, Mode of Grouped Data, Cumulative Frequency Graph and Ogive- 1 | RS Aggarwal Solutions for Class 10 Mathematics
So, N = 98
⇒ N/2 = 98/2 = 49
The cumulative frequency just greater than (N/2 = )49 is 70, so the corresponding median class is 90.5 - 100.5 and accordingly we get Cf = 40(cumulative frequency before the median class).
Now, since median class is 90.5 - 100.5.
∴ l = 90.5, h = 10, f = 30, N/2 = 49 and Cf = 40
Median is given by,
RS Aggarwal Solutions: Mean, Median, Mode of Grouped Data, Cumulative Frequency Graph and Ogive- 1 | RS Aggarwal Solutions for Class 10 Mathematics
= 90.5 + 3
= 93.5
Thus, median is Rs. 93.5.


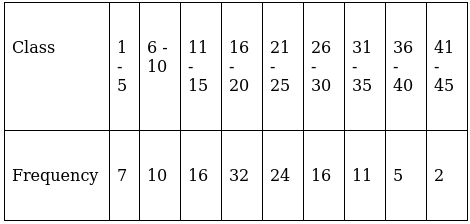
Q.13. Find the median from the following data:
RS Aggarwal Solutions: Mean, Median, Mode of Grouped Data, Cumulative Frequency Graph and Ogive- 1 | RS Aggarwal Solutions for Class 10 Mathematics

To find median, Assume
Σfi = N = Sum of frequencies,
h = length of median class,
l = lower boundary of the median class,
f = frequency of median class
and C= cumulative frequency
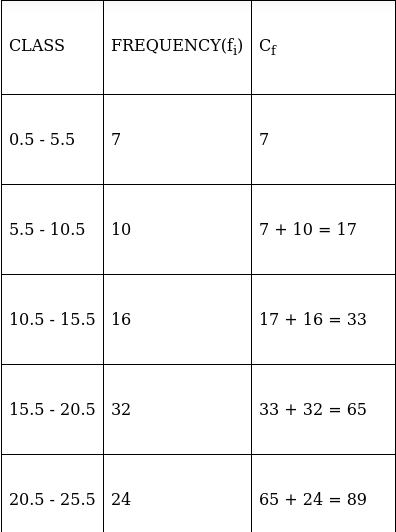
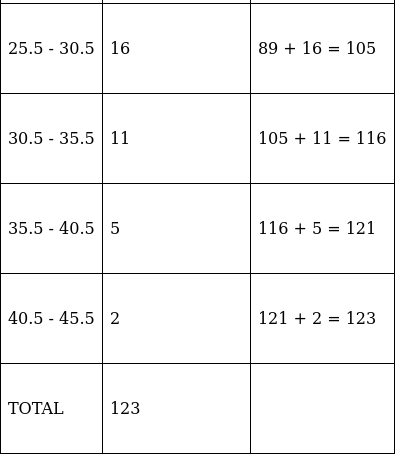
Lets form a table and convert it into exclusive - type by adjusting from both ends of a class.
RS Aggarwal Solutions: Mean, Median, Mode of Grouped Data, Cumulative Frequency Graph and Ogive- 1 | RS Aggarwal Solutions for Class 10 Mathematics
So, N = 123
⇒ N/2 = 123/2 = 61.5
The cumulative frequency just greater than (N/2 = )61.5 is 65, so the corresponding median class is 15.5 - 20.5 and accordingly we get Cf = 33(cumulative frequency before the median class).
Now, since median class is 15.5 - 20.5.
∴ l = 15.5, h = 5, f = 32, N/2 = 61.5 and Cf = 33
Median is given by,
RS Aggarwal Solutions: Mean, Median, Mode of Grouped Data, Cumulative Frequency Graph and Ogive- 1 | RS Aggarwal Solutions for Class 10 Mathematics
= 15.5 + 4.45
= 19.95
Thus, median is 19.95.


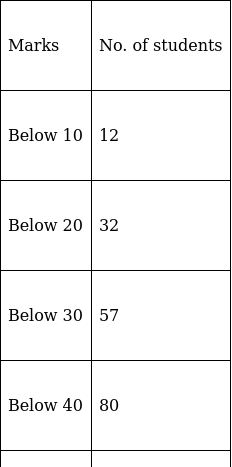
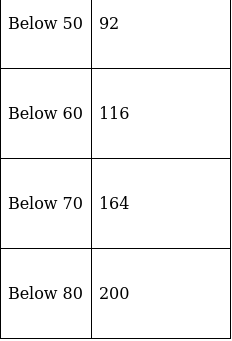
Q.14. Find the median from the following data:
RS Aggarwal Solutions: Mean, Median, Mode of Grouped Data, Cumulative Frequency Graph and Ogive- 1 | RS Aggarwal Solutions for Class 10 Mathematics

To find median, Assume
Σfi = N = Sum of frequencies,
h = length of median class,
l = lower boundary of the median class,
f = frequency of median class
and Cf = cumulative frequency
Lets form a table and convert it into exclusive - type.
RS Aggarwal Solutions: Mean, Median, Mode of Grouped Data, Cumulative Frequency Graph and Ogive- 1 | RS Aggarwal Solutions for Class 10 Mathematics
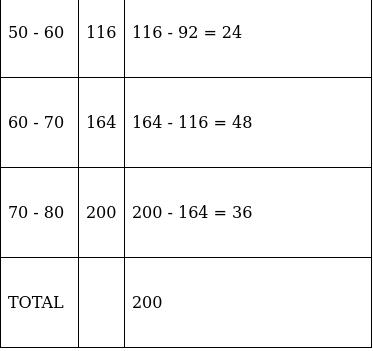
So, N = 200
⇒ N/2 = 200/2 = 100
The cumulative frequency just greater than (N/2 = )100 is 116, so the corresponding median class is 50 - 60 and accordingly we get Cf = 92(cumulative frequency before the median class).
Now, since median class is 50 - 60.
∴ l = 50, h = 10, f = 24, N/2 = 100 and Cf = 92
Median is given by,
RS Aggarwal Solutions: Mean, Median, Mode of Grouped Data, Cumulative Frequency Graph and Ogive- 1 | RS Aggarwal Solutions for Class 10 Mathematics
= 50 + 3.33
= 53.33
Thus, median is 53.33.

The document RS Aggarwal Solutions: Mean, Median, Mode of Grouped Data, Cumulative Frequency Graph and Ogive- 1 | RS Aggarwal Solutions for Class 10 Mathematics is a part of the Class 10 Course RS Aggarwal Solutions for Class 10 Mathematics.
All you need of Class 10 at this link: Class 10
53 docs|15 tests

Top Courses for Class 10

Explore Courses for Class 10 exam

Top Courses for Class 10

Signup for Free!
Signup to see your scores go up within 7 days! Learn & Practice with 1000+ FREE Notes, Videos & Tests.
10M+ students study on EduRev
Related Searches

pdf

,

Viva Questions

,

Sample Paper

,

Important questions

,

Summary

,

Median

,

video lectures

,

mock tests for examination

,

ppt

,

shortcuts and tricks

,

Semester Notes

,

Cumulative Frequency Graph and Ogive- 1 | RS Aggarwal Solutions for Class 10 Mathematics

,

RS Aggarwal Solutions: Mean

,

Median

,

RS Aggarwal Solutions: Mean

,

Previous Year Questions with Solutions

,

MCQs

,

Median

,

Objective type Questions

,

Exam

,

Extra Questions

,

Cumulative Frequency Graph and Ogive- 1 | RS Aggarwal Solutions for Class 10 Mathematics

,

past year papers

,

study material

,

Mode of Grouped Data

,

Free

,

practice quizzes

,

Mode of Grouped Data

,

Mode of Grouped Data

,

Cumulative Frequency Graph and Ogive- 1 | RS Aggarwal Solutions for Class 10 Mathematics

,

RS Aggarwal Solutions: Mean

;