Multiple Choice Questions (MCQ)
Question for RS Aggarwal Solutions: Mean, Median, Mode of Grouped Data, Cumulative Frequency Graph and Ogive- 3
Try yourself:Which of the following is not a measure of central tendency?
Explanation
Mean, median and mode are a measure of central tendency but range of a set of data is the difference between the largest and smallest values.
Report a problem
Question for RS Aggarwal Solutions: Mean, Median, Mode of Grouped Data, Cumulative Frequency Graph and Ogive- 3
Try yourself:Which of the following cannot be determined graphically?
Explanation
Mean is just the average of some observations. It cannot be determined graphically as the values cannot be Summed up.
Report a problem
Question for RS Aggarwal Solutions: Mean, Median, Mode of Grouped Data, Cumulative Frequency Graph and Ogive- 3
Try yourself:Which of the following measures of central tendency is influenced by extreme values?
Explanation
Mean is influenced by extreme values in class intervals, while median and mode is not influenced by extreme values as median is the mid value among observations and mode is the value that is come often in a set of data values and they are independent of extreme values.
Report a problem
Question for RS Aggarwal Solutions: Mean, Median, Mode of Grouped Data, Cumulative Frequency Graph and Ogive- 3
Try yourself:The mode of a frequency distribution is obtained graphically from
Explanation
A histogram shows frequencies of value and mode of frequency distribution can be obtained from a histogram.
Report a problem
Question for RS Aggarwal Solutions: Mean, Median, Mode of Grouped Data, Cumulative Frequency Graph and Ogive- 3
Try yourself:The median of a frequency distribution is found graphically with the help of
Explanation
An ogive is a type of frequency polygon that shows cumulative frequencies and median is the mid - value among given values. Graphically, median can be found by ogive as corresponding to one axis, we get the value on the other axis in an ogive.
Report a problem
Question for RS Aggarwal Solutions: Mean, Median, Mode of Grouped Data, Cumulative Frequency Graph and Ogive- 3
Try yourself:The cumulative frequency table is useful in determining the
Explanation
Cumulative frequency table is useful in determining the median in the case of class intervals.
Report a problem
Question for RS Aggarwal Solutions: Mean, Median, Mode of Grouped Data, Cumulative Frequency Graph and Ogive- 3
Try yourself:The abscissa of the point of intersection of the Less Than Type and of the More Than Type cumulative frequency curves of a grouped data gives its
Explanation
The abscissa of the point of intersection of the ‘less than type’ and ‘more than type’ cumulative frequency curves of the grouped data gives its median as it gives accurate mid - point among all values.
Report a problem
Question for RS Aggarwal Solutions: Mean, Median, Mode of Grouped Data, Cumulative Frequency Graph and Ogive- 3
Try yourself:If xi's are the midpoints of the class intervals of a grouped data, fi's are the corresponding frequencies and 7 is the mean then 
Explanation
Report a problem
Question for RS Aggarwal Solutions: Mean, Median, Mode of Grouped Data, Cumulative Frequency Graph and Ogive- 3
Try yourself:For finding the mean by using the formula,  we have ui = ?
Explanation
Since, di = xi – A,
where di = deviation and A = Assumed mean
And ui = di/h = (xi – A)/h,
where h = class width
Report a problem
Question for RS Aggarwal Solutions: Mean, Median, Mode of Grouped Data, Cumulative Frequency Graph and Ogive- 3
Try yourself:In the formula,  for finding the mean of the grouped data, the di's are the deviations from A of
Explanation
For finding the mean of the grouped data, di’s are deviations from A(Assumed mean) of the midpoints of the classes. It is necessary to find midpoints of the class intervals to find mean of the grouped data.
Report a problem
Question for RS Aggarwal Solutions: Mean, Median, Mode of Grouped Data, Cumulative Frequency Graph and Ogive- 3
Try yourself:While computing the mean of the grouped data, we Assume that the frequencies are
Explanation
Class marks are the aggregates value of the classes and is given by:
Class mark = (lower limit + upper limit)/2
And the frequencies are Assumed to be centered at the class marks of the classes.
Report a problem
Question for RS Aggarwal Solutions: Mean, Median, Mode of Grouped Data, Cumulative Frequency Graph and Ogive- 3
Try yourself:The relation between mean, mode and median is
Explanation
This relationship between mean, median and mode is also called empirical relationship and is given by, mode = (3 × median) – (2 × mean)
Report a problem
Question for RS Aggarwal Solutions: Mean, Median, Mode of Grouped Data, Cumulative Frequency Graph and Ogive- 3
Try yourself:If the 'less than type' ogive and 'more than type' ogive intersect each other at (20.5, 15.5) then the median of the given data is
Explanation
If ‘less than type’ ogive and ‘more than type’ ogive intersect each other at (20.5,15.5), then median of the given data is 20.5 as median in this kind of graph is found on x - axis, which represents class intervals (upper limit/lower limit).
Report a problem
Question for RS Aggarwal Solutions: Mean, Median, Mode of Grouped Data, Cumulative Frequency Graph and Ogive- 3
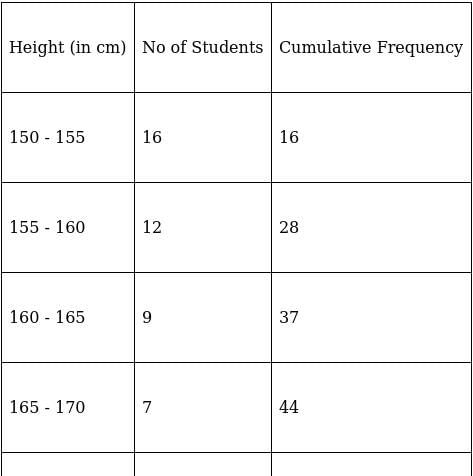
Try yourself:Consider the frequency distribution of the heights of 60 students of a class:


The Sum of the lower limit of the modal class and the upper limit of the median class is
Explanation
To find median class,
Assume Σfi = N = Sum of frequencies,
fi = frequency
and Cf = cumulative frequency


So, N = 60
⇒ N/2 = 60/2 = 30
The cumulative frequency just greater than (N/2 = ) 30 is 37, so the corresponding median class is 160 - 165.
∴ upper limit of median class = 165
For modal class,
Here, the maximum class frequency is 16.
The class corresponding to this frequency is the modal class. ⇒ modal class = 150 - 155
∴ lower limit of the modal class = 150
Hence, Sum of lower limit of the modal class and upper limit of the median class = 165 + 150 = 315
Report a problem
Question for RS Aggarwal Solutions: Mean, Median, Mode of Grouped Data, Cumulative Frequency Graph and Ogive- 3
Try yourself:Consider the following frequency distribution:

The modal class is
Explanation
For modal class,
Here, the maximum class frequency is 30.
The class corresponding to this frequency is the modal class. ⇒ modal class = 30 - 40
∴ modal class = 30 - 40
Report a problem
Question for RS Aggarwal Solutions: Mean, Median, Mode of Grouped Data, Cumulative Frequency Graph and Ogive- 3
Try yourself:Mode = ?
Explanation
Mode is given by,

where,
xk = lower limit of the modal class,
h = class width,
fk = frequency of the modal class,
fk - 1 = frequency of class preceding the modal class
and fk + 1 = frequency of class succeeding the modal class
Report a problem
Question for RS Aggarwal Solutions: Mean, Median, Mode of Grouped Data, Cumulative Frequency Graph and Ogive- 3
Try yourself:Median = ?
Explanation
Medium is given by,

Where
N = Sum of frequencies,
h = length of median class,
l = lower boundary of the median class,
f = frequency of median class
and Cf = cumulative frequency
Report a problem
Question for RS Aggarwal Solutions: Mean, Median, Mode of Grouped Data, Cumulative Frequency Graph and Ogive- 3
Try yourself:If the mean and median of a set of numbers are 8.9 and 9 respectively then the mode will be
Explanation
Given: mean = 8.9 and median = 9
By empirical formula,
mode = (3 × median) – (2 × mean)
⇒ mode = (3 × 9) – (2 × 8.9)
⇒ mode = 27 – 17.8 = 9.2
Report a problem
Question for RS Aggarwal Solutions: Mean, Median, Mode of Grouped Data, Cumulative Frequency Graph and Ogive- 3
Try yourself:Look at the frequency distribution table given below:

The median of the above distribution is
Explanation
To find median,
Assume Σfi = N = Sum of frequencies,
h = length of median class,
l = lower boundary of the median class,
f = frequency of median class
and Cf = cumulative frequency
Lets form a table.

So, N = 50
⇒ N/2 = 50/2 = 25
The cumulative frequency just greater than (N/2 = ) 25 is 40, so the corresponding median class is 55 - 65 and accordingly we get Cf = 20(cumulative frequency before the median class).
Now, since median class is 55 - 65.
∴ l = 55, h = 10, f = 20, N/2 = 25 and Cf = 20
Median is given by,


= 55 + 2.5
= 57.5
Thus, median age is 57.5.
Report a problem
Question for RS Aggarwal Solutions: Mean, Median, Mode of Grouped Data, Cumulative Frequency Graph and Ogive- 3
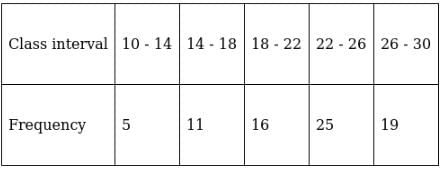
Try yourself:Consider the following table:

The mode of the above data is
Explanation
Report a problem
Question for RS Aggarwal Solutions: Mean, Median, Mode of Grouped Data, Cumulative Frequency Graph and Ogive- 3
Try yourself:The mean and mode of a frequency distribution are 28 and 16 respectively. The median is
Explanation
Given: mean = 28 and mode = 16
By empirical formula,
mode = (3 × median) – (2 × mean)
⇒ 3 × median = mode + (2 × mean)
⇒ 3 × median = 16 + (2 × 28)
⇒ 3 × median = 16 + 56
⇒ 3 × median = 72
⇒ median = 72/3 = 24
Report a problem
Question for RS Aggarwal Solutions: Mean, Median, Mode of Grouped Data, Cumulative Frequency Graph and Ogive- 3
Try yourself:The median and mode of a frequency distribution are 26 and 29 respectively. Then, the mean is
Explanation
Given: median = 26 and mode = 29
By empirical formula,
mode = (3 × median) – (2 × mean)
⇒ 2 × mean = (3 × median) – mode
⇒ 2 × mean = (3 × 26) – 29
⇒ 2 × mean = 78 – 29
⇒ 2 × mean = 49
⇒ mean = 49/2 = 24.5
Report a problem
Question for RS Aggarwal Solutions: Mean, Median, Mode of Grouped Data, Cumulative Frequency Graph and Ogive- 3
Try yourself:For a symmetrical frequency distribution, we have
Explanation
As in a symmetrical frequency distribution, the left and right hand side of the distribution is roughly equally balanced around the mean of the distribution.
Report a problem
Question for RS Aggarwal Solutions: Mean, Median, Mode of Grouped Data, Cumulative Frequency Graph and Ogive- 3
Try yourself:Look at the cumulative frequency distribution table given below:


Number of families having income range 20000 to 25000 is
Explanation


From the above table, number of families having income range 20000 - 25000 is 13. (Observe the frequency values corresponding to the monthly income)
Report a problem
Question for RS Aggarwal Solutions: Mean, Median, Mode of Grouped Data, Cumulative Frequency Graph and Ogive- 3
Try yourself:The median of first 8 prime numbers is
Explanation
Listing out all first 8 prime numbers, we have
2, 3, 5, 7, 11, 13, 17, 19
Since, the median will be at the aggregate of the (8/2 =) 4th position and (8/2 + 1 = ) 5th position.
We have, (7 + 11)/2 = 18/2 = 9
Thus, median is 9.
Report a problem
Question for RS Aggarwal Solutions: Mean, Median, Mode of Grouped Data, Cumulative Frequency Graph and Ogive- 3
Try yourself:The mean of 20 numbers is zero. Of them, at the most, how many may be greater than zero?
Explanation
It’s given that mean of 20 numbers is 0, which implies that average of 20 numbers is 0.
This means that Sum of 20 numbers is 0.
If Sum of 19 numbers out of 20 is x(say), then the 20th number will be absolutely 0 for the average to be 0.
⇒ At the most, 19 numbers will be positive.
Report a problem
Question for RS Aggarwal Solutions: Mean, Median, Mode of Grouped Data, Cumulative Frequency Graph and Ogive- 3
Try yourself:If the median of the data 4,7,x - 1,X - 3,l6,25, written in ascending order, is 13 then x is equal to
Explanation
Since there are 6 number of observation in all, which is an even number of observation.
Median will be found at the aggregate of (6/2 = ) 3rd and (6/2 + 1 = ) 4th position.
3rd value = x – 1 and 4th value = x – 3
Taking their aggregate, we get
Median = (x – 1 + x – 3)/2
⇒ 13 = (2x – 4)/2 [∵ median = 13]
⇒ 26 = 2x – 4
⇒ 2x = 26 + 4
⇒ 2x = 30
⇒ x = 15
Thus, median is 15.
Report a problem
Question for RS Aggarwal Solutions: Mean, Median, Mode of Grouped Data, Cumulative Frequency Graph and Ogive- 3
Try yourself:The mean of 2, 7, 6 and x is 15 and the mean of 18, 1, 6, x and y is 10. What is the value of y?
Explanation
Report a problem
Question for RS Aggarwal Solutions: Mean, Median, Mode of Grouped Data, Cumulative Frequency Graph and Ogive- 3
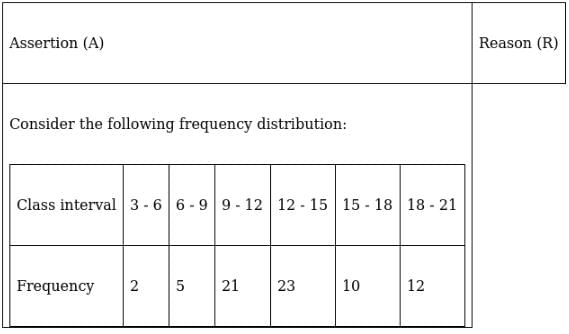
Try yourself:Each question consists of two statements, namely, Assertion (A) and Reason (R). For selecting the correct answer, use the following code:

Explanation
According to Reason(R),
Relationship between mean, median and mode is,
Mode = 3(Median) – 2(Mean)
If we substitute the values given in the above relationship,
Median = 150 and Mean = 148 (given)
Mode = 3(150) – 2(148)
⇒ Mode = 450 – 296 = 154
We get mode = 154, which satisfies the assertion.
Thus, Assertion(A) and Reason(R) are true and Reason(R) is the correct explanation of the Assertion(A).
Report a problem
Question for RS Aggarwal Solutions: Mean, Median, Mode of Grouped Data, Cumulative Frequency Graph and Ogive- 3
Try yourself:Each question consists of two statements, namely, Assertion (A) and Reason (R). For selecting the correct answer, use the following code:

The mode of the above data is 12.4.
The value of the variable which occurs most often is the mode.
Explanation
Report a problem

 we have ui = ?
 for finding the mean of the grouped data, the di's are the deviations from A of


