Class 10 Exam > Class 10 Notes > The Complete SAT Course > Rate of Change Graphical Questions
Rate of Change Graphical Questions | The Complete SAT Course - Class 10 PDF Download

Rate of Change
A rate of change is a rate that describes how one quantity changes in relation to another quantity. If x is the independent variable and y is the dependent variable, then
rate of change = change in y / change in x
Rates of change can be positive or negative. This corresponds to an increase or decrease in the y -value between the two data points. When a quantity does not change over time, it is called zero rate of change.
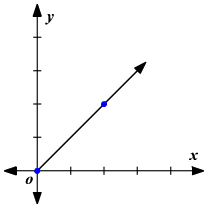
Positive rate of change
When the value of x increases, the value of y increases and the graph slants upward.
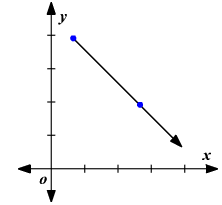
Negative rate of change
When the value of x increases, the value of y decreases and the graph slants downward.
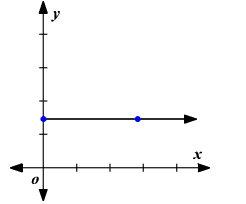
Zero rate of change
When the value of x increases, the value of y remains constant. That is, there is no change in y value and the graph is a horizontal line .
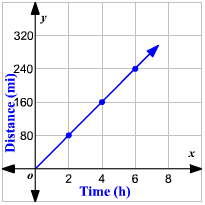
Example: Use the table to find the rate of change. Then graph it.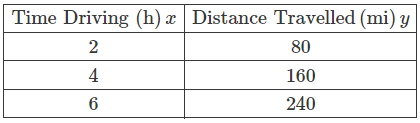
A rate of change is a rate that describes how one quantity changes in relation to another quantity.
rate of change = change in y / change in x
= change in distance / change in time
= 160 − 80 / 4 − 2
= 80/2
= 40/1
= 40
The rate of change is 40/1 or 40 . This means a vehicle is traveling at a rate of 40 miles per hour.
The document Rate of Change Graphical Questions | The Complete SAT Course - Class 10 is a part of the Class 10 Course The Complete SAT Course.
All you need of Class 10 at this link: Class 10
|
433 videos|220 docs|166 tests
|
About this Document

4.75/5
Rating

Sep 28, 2025
Last updated
Document Description: Rate of Change Graphical Questions for Class 10 2025 is part of The Complete SAT Course preparation.
The notes and questions for Rate of Change Graphical Questions have been prepared according to the Class 10 exam syllabus. Information about Rate of Change Graphical Questions covers topics
like Rate of Change and Rate of Change Graphical Questions Example, for Class 10 2025 Exam. Find important definitions, questions, notes, meanings, examples, exercises and tests below for Rate of Change Graphical Questions.
Introduction of Rate of Change Graphical Questions in English is available as part of our The Complete SAT Course
for Class 10 & Rate of Change Graphical Questions in Hindi for The Complete SAT Course course.
Download more important topics related with notes, lectures and mock test series for Class 10
Exam by signing up for free. Class 10: Rate of Change Graphical Questions | The Complete SAT Course - Class 10
Description
Full syllabus notes, lecture & questions for Rate of Change Graphical Questions | The Complete SAT Course - Class 10 - Class 10 | Plus excerises question with solution to help you revise complete syllabus for The Complete SAT Course | Best notes, free PDF download
Information about Rate of Change Graphical Questions
In this doc you can find the meaning of Rate of Change Graphical Questions defined & explained in the simplest way possible. Besides explaining types of
Rate of Change Graphical Questions theory, EduRev gives you an ample number of questions to practice Rate of Change Graphical Questions tests, examples and also practice Class 10
tests
Related Searches
Objective type Questions
,Free
,Viva Questions
,Summary
,Semester Notes
,past year papers
,MCQs
,mock tests for examination
,practice quizzes
,Exam
,Extra Questions
,video lectures
,Rate of Change Graphical Questions | The Complete SAT Course - Class 10
,ppt
,Sample Paper
,study material
,Previous Year Questions with Solutions
,Important questions
,Rate of Change Graphical Questions | The Complete SAT Course - Class 10
,Rate of Change Graphical Questions | The Complete SAT Course - Class 10
,shortcuts and tricks
;


Additional Information about Rate of Change Graphical Questions for Class 10 Preparation
Rate of Change Graphical Questions Free PDF Download
The Rate of Change Graphical Questions is an invaluable resource that delves deep into the core of the Class 10 exam.
These study notes are curated by experts and cover all the essential topics and concepts, making your preparation more efficient and effective.
With the help of these notes, you can grasp complex subjects quickly, revise important points easily,
and reinforce your understanding of key concepts. The study notes are presented in a concise and easy-to-understand manner,
allowing you to optimize your learning process. Whether you're looking for best-recommended books, sample papers, study material,
or toppers' notes, this PDF has got you covered. Download the Rate of Change Graphical Questions now and kickstart your journey towards success in the Class 10 exam.
Importance of Rate of Change Graphical Questions
The importance of Rate of Change Graphical Questions cannot be overstated, especially for Class 10 aspirants.
This document holds the key to success in the Class 10 exam.
It offers a detailed understanding of the concept, providing invaluable insights into the topic.
By knowing the concepts well in advance, students can plan their preparation effectively.
Utilize this indispensable guide for a well-rounded preparation and achieve your desired results.
Rate of Change Graphical Questions Notes
Rate of Change Graphical Questions Notes offer in-depth insights into the specific topic to help you master it with ease.
This comprehensive document covers all aspects related to Rate of Change Graphical Questions.
It includes detailed information about the exam syllabus, recommended books, and study materials for a well-rounded preparation.
Practice papers and question papers enable you to assess your progress effectively.
Additionally, the paper analysis provides valuable tips for tackling the exam strategically.
Access to Toppers' notes gives you an edge in understanding complex concepts.
Whether you're a beginner or aiming for advanced proficiency, Rate of Change Graphical Questions Notes on EduRev are your ultimate resource for success.
Rate of Change Graphical Questions Class 10
The "Rate of Change Graphical Questions Class 10 Questions" guide is a valuable resource for all aspiring students preparing for the
Class 10 exam. It focuses on providing a wide range of practice questions to help students gauge
their understanding of the exam topics. These questions cover the entire syllabus, ensuring comprehensive preparation.
The guide includes previous years' question papers for students to familiarize themselves with the exam's format and difficulty level.
Additionally, it offers subject-specific question banks, allowing students to focus on weak areas and improve their performance.
Study Rate of Change Graphical Questions on the App
Students of Class 10 can study Rate of Change Graphical Questions alongwith tests & analysis from the EduRev app,
which will help them while preparing for their exam. Apart from the Rate of Change Graphical Questions,
students can also utilize the EduRev App for other study materials such as previous year question papers, syllabus, important questions, etc.
The EduRev App will make your learning easier as you can access it from anywhere you want.
The content of Rate of Change Graphical Questions is prepared as per the latest Class 10 syllabus.
|
© EduRev
|
Education Revolution
|


|


Signup to see your scores
go up within 7 days!
Access 1000+ FREE Docs, Videos and Tests
Takes less than 10 seconds to signup