Introduction to Data Representation Questions | Science for ACT PDF Download
Introduction
Interpreting graphs can be likened to reading in an unfamiliar language. While some individuals find it effortless, others encounter great difficulty. If comprehending graphs, tables, and other visual aids for ACT Science questions poses a challenge for you, this chapter provides valuable tips, strategies, and practice questions tailored to your needs.
Even if you consider yourself a proficient graph reader, this chapter serves as a useful refresher to ensure your skills remain sharp. The ACT Science section often presents novel and demanding ways of assessing basic visual interpretation abilities, making this chapter indispensable for equipping you with strategies for both straightforward and challenging questions.
The majority of questions in the ACT Science section focus on evaluating visuals and relaying information. To address these questions, it is crucial to analyze and interpret graphs, tables, and scatterplots. Most passages in the ACT Science section consist of brief paragraphs accompanied by 1-4 visual representations of data, such as graphs, tables, or scatterplots. The passages often reference specific studies and designate sections as Study 1/2/3.
The following are some of the important elements of a figure/table/chart:
1. Graph Axes
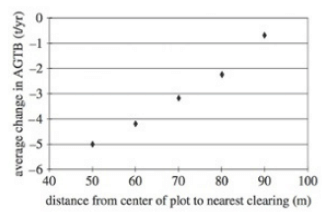
Axes play a vital role in identifying the control and variable(s) in an experiment. Now, let's examine this uncomplicated graph to enhance our understanding:

Within this graph, the x-axis represents the distance from the center of the plot to the closest clearing. Meanwhile, the y-axis represents the average change in AGTB (the specific meaning of AGTB is not crucial for understanding).
In terms of the research, the average change in AGTB serves as the "dependent variable." For instance, we may inquire about the average change in AGTB when the distance from the center of the plot to the nearest clearing is 50 m.
To find the answer, we locate the point corresponding to 50 on the x-axis, which signifies the distance measurement. Subsequently, we refer to the y-axis to identify the value for the average change in AGTB, which, in this case, reads as 5 t/yr.
2. Units of Measure
The ACT Science section incorporates peculiar and unfamiliar units that you may not have encountered unless you have studied advanced Physics or Chemistry. It is unnecessary to grasp the precise meaning of these units in order to answer the questions.
For instance, in the previous diagram, you might recognize "m" as meters, but you may be unfamiliar with the unit "t/yr." Nevertheless, this lack of familiarity does not hinder you from correctly responding to the question based on the provided graph.
Throughout all the practice sections I have encountered, I have never come across an ACT Science question that requires converting units from one form of measurement to another. While you may have acquired such skills in Math or Science classes, you can set them aside for now, as they are not required in this context.
3. Independent and Dependent Variables
When examining graphs and tables, it is essential to differentiate between the independent and dependent variables.
A straightforward approach to distinguishing between these variables is to utilize the phrase "_____ depends on _____," where the first blank represents the dependent variable, and the second blank represents the independent variable.
For example, consider an experiment where the amount of water provided to plants is varied, and their growth is measured.
Let's evaluate both statements and select the one that makes logical sense: "Amount of water depends on plant growth" OR "Plant growth depends on the amount of water."
The second statement holds true - the growth of the plants is contingent on the quantity of water they receive.
Now, let's consider another scenario: "Wind speed depended on the time of day" OR "The time of day depended on wind speed."
Since wind speed fluctuates throughout the day, it is the time of day that influences the speed, rather than the other way around.
Here's another helpful tip: independent variables are typically represented on the x-axis, while dependent variables are plotted on the y-axis. By employing this guideline and utilizing clues from graphs, you can effectively differentiate between independent and dependent variables.
Keeping these objectives in mind, let's engage in a practice question that involves analyzing a graph. This exercise will demonstrate how such techniques enable us to swiftly comprehend and analyze the given figure.

Example:
Q. Reef coral faces the greatest risk when temperatures consistently surpass a 0.1 anomaly for multiple years. Referring to the given figure, the initial significant period of coral trauma occurred around:
A. 1900
B. 1945
C. 1990
D. 2000
Correct Answer is Option C.
To find the answer, we examine the graph illustrating temperature anomalies from meteorological stations, which presents both annual means and a five-year mean spanning from 1880 to 2010. The graph illustrates the correlation between temperature anomalies (Y-axis) and time (X-axis).
Our task is to identify the first time period when the anomaly extends beyond 0.1 for several consecutive years, indicated by a series of black dots above the 0.1 line. Upon careful observation, this sustained anomaly trend becomes noticeable only in the late 1980s, as the last dip below 0.1 occurred around 1985. Hence, we can select option C as the correct answer, representing several years of consistent anomalies.
4. Control Group
In an experiment, a control group serves as a reference point where no changes or interventions are applied. For instance, before genetically modifying a tomato, it is essential to have a regular, unaltered tomato as a baseline. Similarly, when testing different types of enhanced fertilizers in fields, it is necessary to establish a benchmark using a standard, non-enhanced fertilizer.
To better understand the concept of control groups, let's elucidate the variables involved through the following example:

By examining this figure, we can discern that pH is the intentionally manipulated variable, while concentration (measured in kg/L) is the variable being observed.
Furthermore, let's consider whether any other variables, such as water temperature or air pressure, are present aside from pH, exposure time, and concentration. Upon inspection, if you are unable to locate those additional variables mentioned in a question's prompt within the figure, it indicates that they are constants. In this case, referring to the adjacent figure, we can conclude that factors like exposure time and concentration, apart from pH, remain constant.
Example:
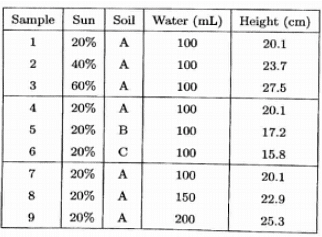
So, when you look at a figure, find what is being changed, what is being measured, and then understand that everything else is constant.

Q. Among Samples 1-3, which element serves as the independent variable?
A. Sun
B. Soil
C. Water (mL)
D. Height (cm)
Correct Answer is Option A
When examining Samples 1-3, we observe that the quantity of sun is being altered while the other factors remain constant. Another distinguishing factor is that the sun amount is intentionally adjusted to neat, round numbers, whereas the height measurements involve more complex decimals. In an experimental setup, the independent variable is intentionally manipulated to round numbers, while the dependent variable is measured with more intricate values. Hence, the correct answer is A.
Q. Among Samples 1-3, which element represents the dependent variable?
A. Sun
B. Soil
C. Water (mL)
D. Height (cm)
Correct Answer is Option D
Since the height is varying across Samples 1-3, it serves as the dependent variable. Therefore, the correct answer is D.
Q. Among Samples 1-3, which element(s) represent the constants? (More than one answer may be correct)
A. Sun
B. Soil
C. Water (mL)
D. Height (cm)
Correct Answer is Option A & B
The sun and soil factors remain consistent throughout Samples 1-3, making them the constants. Hence, the correct answers are A and B.
|
486 videos|517 docs|337 tests
|

|
Explore Courses for ACT exam
|

|


