Unveiling the Mysteries of Decay Graphs and Half-Lives | General Chemistry for MCAT PDF Download
| Table of contents |

|
| Introduction |

|
| The Decrease in Radioactive Elements Over Time |

|
| Interpreting Decay Graphs |

|
| Half-Life: Unveiling Stability and Age Estimation |

|
| Conclusion |

|
Introduction
Radiation is more than just a spooky phenomenon depicted in movies. Scientists have discovered innovative ways to harness the unique properties of radiation for medical purposes, such as diagnosing diseases. The release of radiation occurs when an unstable nucleus undergoes changes in its composition. This intriguing process, known as radioactive decay, can be categorized into three types: alpha decay, beta decay, and gamma decay. In this article, we will delve into the fascinating world of decay graphs and half-lives, exploring how scientists analyze and interpret these graphs to unravel the secrets of radioactive isotopes.
- Alpha Decay: Splitting the Nucleus Alpha decay involves the splitting of a nucleus into two fragments: an alpha particle consisting of two protons and two neutrons, and a daughter nucleus with a lower atomic number. The emitted radiation is represented by the high-speed alpha particle that moves away from the nucleus.
- Beta Decay: Transformations of Neutrons and Protons Beta decay encompasses two variations: beta-minus decay and beta-positive decay. In beta-minus decay, a neutron changes into a proton, emitting an electron and an antineutrino to maintain overall charge balance. The fast-moving electron is the radiation released in this type of decay. Conversely, in beta-positive decay, a proton transforms into a neutron, resulting in the emission of a positron or an anti-electron.
- Gamma Decay: Rearranging Without Changing Composition Gamma decay involves the rearrangement of protons, neutrons, and electrons within the atom, leading to the release of high-energy photons, known as gamma radiation. This rearrangement occurs to achieve a lower overall energy while maintaining the same number of particles.
The Decrease in Radioactive Elements Over Time
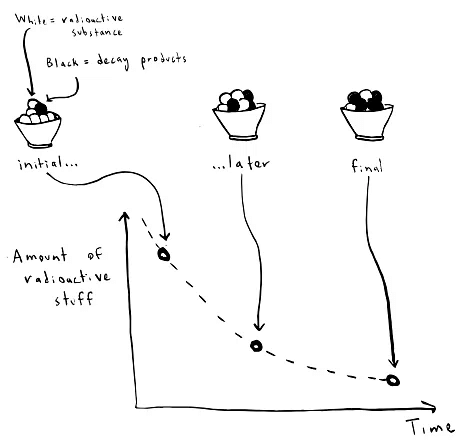
In all types of radioactive decay, the total quantity of radioactive isotopes diminishes over time. This phenomenon allows scientists to identify unknown isotopes based on their decay rates. By measuring the number of atoms of a particular isotope and observing their reduction over a period, scientists can ascertain the type of decay and identify the product of the decay process. For instance, if a scientist examines a sample of carbon-10 undergoing beta decay, she will find a decrease in carbon-10 atoms while the element boron, the product of decay, increases.

Mathematical Modeling of Decay: The Decay Constant
Although the decay of individual nuclei is random, large numbers of nuclei can be mathematically modeled using an exponential decay function. The function predicts the remaining amount of radioactive nuclei at any given time. The decay constant, denoted as "k," determines the rate at which the total number of nuclei decreases. This value varies according to the type of decay and the isotope under study. Consequently, the decay constant serves as a tool to identify unknown isotopes by examining their decay rates.
The Relationship Between Mass and Decay: Mass Spectrometry
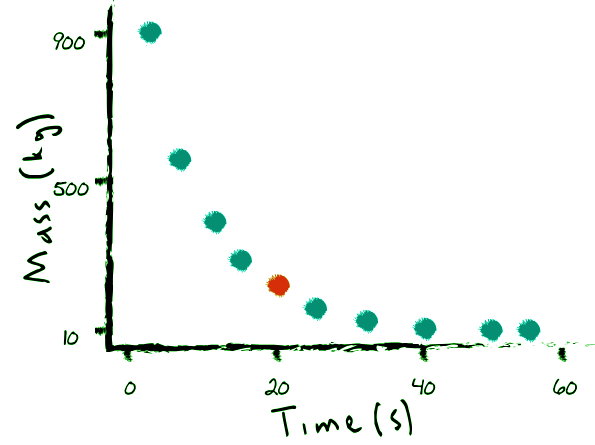
Since the mass of an isotope sample directly corresponds to the total number of atoms, the mass of an isotope also decays exponentially with the same decay constant. By employing mass spectrometry or similar techniques, scientists can analyze the relative mass of various isotopes in a sample. As the isotope decays, the mass of its decay products, such as boron or radiation particles, gradually increases. Plotting the mass of a sample over time reveals a characteristic decay graph, showcasing the exponential decline in mass.
Interpreting Decay Graphs
Deciphering decay graphs is essential for identifying unknown radioactive isotopes. Scientists generate exponential decay graphs by measuring the total mass of a radioactive isotope sample repeatedly. At the beginning of the experiment, the sample is analyzed using a mass spectrometer to determine the current fraction of various isotopes present. Subsequently, measurements are taken at later intervals, noting the changing fractions of isotopes. The observed fractions of radioactive isotopes display an exponential decrease over time, while the mass of decay products steadily increases. By plotting this information, scientists can estimate the decay constant and consult a glossary of known decay constants to identify the isotope.

Exploring Semilog Plots: A Different Perspective
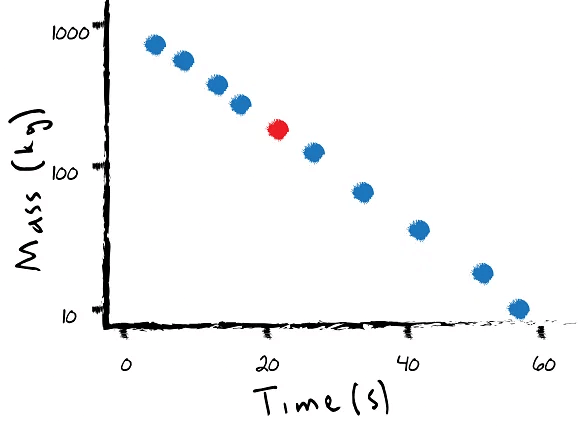
Scientists also employ semilog plots to present nuclear decay data. Unlike exponential decay graphs, semilog plots utilize logarithmic scaling on the vertical axis, creating even spacing between logarithmic values. By taking logarithms of the observed values, scientists can determine the slope of the line on a semilog plot, which corresponds to the decay constant. Semilog plots provide a convenient method for comparing and identifying different isotopes, enhancing scientists' understanding of their behavior.

Unveiling Isotopes through Radiation Analysis
Apart from analyzing decay graphs, scientists can gain further insights into unknown radioactive isotopes by studying the emitted radiation. Gamma decay produces photons, beta decay releases electrons or positrons, and alpha decay emits alpha particles (helium nuclei). Analyzing the type and properties of the radiation provides valuable information about the unknown isotope.
Half-Life: Unveiling Stability and Age Estimation
Half-life represents the time required for half of the atoms in an isotope to undergo decay and transform into another isotope. Similar to the decay constant, the half-life is a crucial parameter for identifying isotopes. Solving the radioactive decay equation reveals that the decay constant and half-life are mathematically equivalent. Scientists often prefer using half-life due to its intuitive interpretation. For example, if a radioactive isotope with a half-life of 30 minutes initially weighs 20 kg, after 30 minutes, it will weigh 10 kg, representing the loss of half the sample. By counting the number of half-lives that have passed, scientists can estimate the age of materials, such as fossils, through techniques like carbon dating.
Conclusion
Decay graphs and half-lives provide scientists with powerful tools to study and identify radioactive isotopes. By analyzing decay patterns, measuring mass, and interpreting radiation emissions, researchers can unravel the mysteries of radioactive decay and gain valuable insights into the age and stability of materials. The ongoing exploration of decay graphs and half-lives fuels scientific advancements and contributes to our understanding of the intricate world of nuclear phenomena.
|
164 videos|11 docs|16 tests
|

|
Explore Courses for MCAT exam
|

|


