Worksheet: Statistics

Multiple Choice Questions
Q1: A histogram has a class interval 40-60, and its rectangle height is 8 units. Another class interval 60-70 has rectangle height 16 units.
If the intervals are unequal, which class has higher frequency density?
(a) 40-60
(b) 60-70
(c) Both equal
(d) Cannot be determined
Q2: In a frequency polygon, if two consecutive class midpoints are incorrectly taken as 2 units closer, what happens to the polygon?
(a) Only the height changes
(b) Only the width changes
(c) Slope becomes steeper or flatter
(d) It becomes impossible to draw
Q3: A bar graph compares profit for 12 months. If the scale is changed from
1 cm = ₹5000 to 1 cm = ₹10,000, the effect is:
(a) Bar widths double
(b) Bar heights become half
(c) Bars shift left
(d) Gaps disappear
Q4: A histogram is used for:
(a) Discrete data
(b) Continuous grouped data
(c) Favourite colours
(d) Names of students
Q5: A bar graph is drawn using:
(a) Bars of equal width
(b) Bars of unequal width
(c) Bars touching each other
(d) No bars at all
Short Answer Questions
Q1: The following data gives the amount of manure (in tones) manufactures by a company during some years.
- Represent it with a bar graph.
- Indicate with help of bar graph in which year, the amount of manufactured by company was maximum.
Q2: Draw a bar graph for the following data: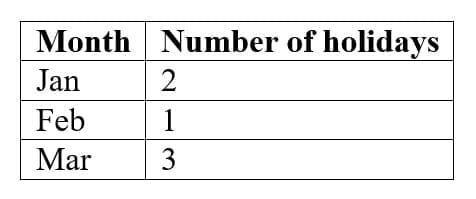
Q3: Find the class mark of 20-30.
Long Answer Questions
Q1: Draw a histogram for this data: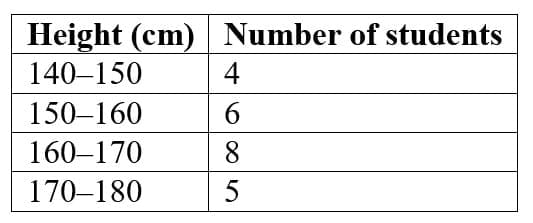
Q2: You are given the following mid-points of a frequency polygon:
20, 30, 40, 50, 60
The polygon rises from (20, 6) to (40, 18), then falls to (60, 4).
(a) Reconstruct the class intervals.
(b) Draw a rough shape description of the polygon.
(c) Explain where the distribution has its "peak" and what it means.
Q3: Below is data of girls per 1000 boys in different sections of society: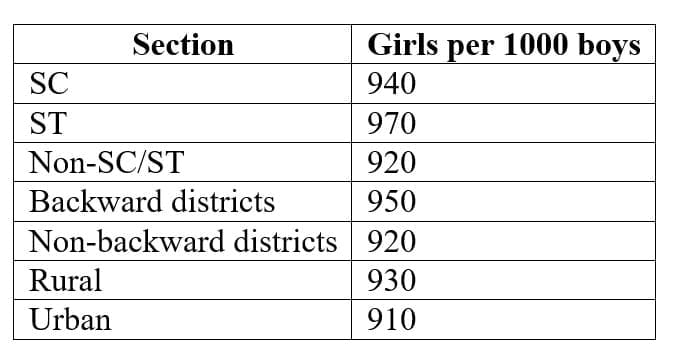
(i) Draw a bar graph for the data.
(ii) Which section shows the highest value?
(iii) Comment on the trend.
You can see the solutions of worksheet here.
FAQs on Worksheet: Statistics
| 1. What is statistics and why is it important in research? |  |
| 2. What are the different types of statistical data? | |
| 3. How do you calculate the mean, median, and mode of a data set? | |
| 4. What is the difference between correlation and causation in statistics? | |
| 5. How do you interpret a p-value in statistical analysis? | |


