Smart Charts - 2 Class 5 Worksheet Maths Chapter 14
Answer the following Questions.
Q1: The following pie chart shows the favorite hobbies of the students of class V. (i) Which is the most favorite hobby?
(ii) Which two hobbies have equal popularity?
(iii) What part of the students like reading as a hobby?
Ans:
(i) Playing football
(ii) Watching TV & Watching Movies
(iii) ¼
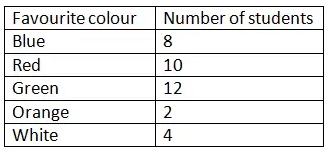
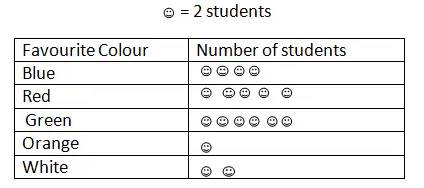
Q2: Draw pictographs for the following data using a suitable symbol: Ans:
Ans:
Q3: From the tally marks given below, answer the following questions:
(i) Write the total number of each vehicle in the table?
(ii) Auto rickshaws are thrice the number of trucks – true/false?
(iii) Write the number of cycles and auto rickshaw?
Ans:
(i) Total number of vehicles = 28 + 12+ 18+ 15+ 24+ 6 = 103.
(ii) True
(iii) Number of cycles = 28
Number of auto rickshaw = 182.
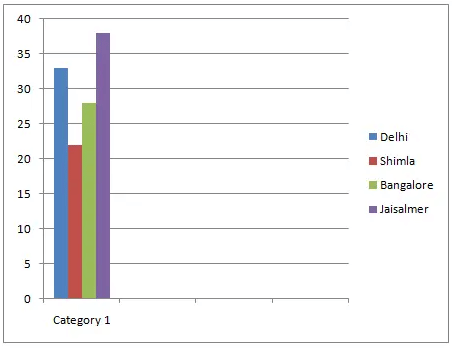
Q4: From the bar graph given below, answer the following:
(i) Which city is the hottest?
(ii) Which city is the coldest?
(iii) Which two cities shows little change in temperature?
Ans:
(i) Jaisalmer
(ii) Shimla
(iii) Shimla & Bangalore
Q5: Anu bought 5 potatoes, 6 tomatoes, 2 cucumber, 7 coconuts and 4 onions. Represent the data by using tally marks.
Ans:
Q6: The relation between dependent and independent variables is shown through a ________.
Ans: The relation between dependent and independent variables is shown through a Graph.
Q7: The number of goals second by a football term in different matches is given below:
3,1,0,4,6,0,0,1,1,2,2,3,5,1,2,0,1,0,2,3,9,2,0,1,0,1,4,1,0,2,5,1,2,
2,3,1,0,0,0,1,1,0,2,3,0,1,5,2,0
Make a frequency distribution table using tally makers.
Ans: Frequency table for the given data is as follows:
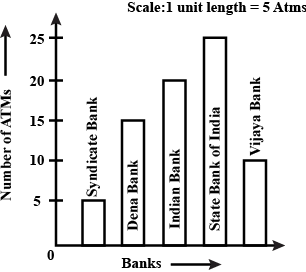
Q8: The number of ATMs of different banks in a cityis shown below:
Draw a bar graph to represent the above information by choosing the scale of your choice.
Ans: Take Number of ATM on the vertical axis and name of Bank on horizontal axis.
Q9: In an examination, the grades achieved by 30 students of a class are given below. Arrange these grades in a table using tally marks:
B, C, C, E, A, C, B, B, D, D, D, D, B, C, C, C, A, C, B, E, A, D, C, B, E, C, B, E, C, D
Ans:
Q10: The marks (out of 10) obtained by 28 students in a Mathematics test are listed as below :
8, 1, 2, 6, 5, 5, 5, 0, 1, 9, 7, 8, 0, 5, 8, 3, 0, 8, 10, 10, 3, 4, 8, 7, 8, 9, 2, 0
The number of students who obtained marks more than or equal to 5 is
Ans: Arranging the given marks in ascending order we get,
0, 0, 0, 0, 1, 1, 2, 2, 3, 3, 4, 5, 5, 5, 5, 6, 7, 7, 8, 8, 8, 8, 8, 8, 9, 9, 10, 10
Students who obtained marks more than or equal 5 are,
5, 5, 5, 5, 6, 7, 7, 8, 8, 8, 8, 8, 8, 9, 9, 10, 10
∴ Number of students who obtained marks more or equal to 5 = 17
|
28 videos|169 docs|41 tests
|
FAQs on Smart Charts - 2 Class 5 Worksheet Maths Chapter 14
| 1. What are smart charts? |  |
| 2. How can smart charts be useful in data analysis? |  |
| 3. How do smart charts use artificial intelligence? |  |
| 4. Can smart charts be customized to suit specific needs? |  |
| 5. Are smart charts user-friendly for individuals with limited technical skills? |  |

|
Explore Courses for Class 5 exam
|

|


