Short Notes: Data Handling


Data
Any raw information which we collect to know about it and to compare certain things is called Data. This information is in the form of facts and figures and is collected for some specific purpose.
Example
- Number of students in the class
- The temperature in a state on daily basis.
Data Handling
We need to collect, organize and represent that data to draw inferences from it. This is called Data Handling.
Collecting Data
- Collection of data depends upon the further requirement of the data. Before collecting any data we must know that what will be the use of data.
- If we have to compare the marks of the toppers in different classes then we need the data of all the classes not only one class having any topper.
Organization of Data
Before using any data, first, we need to organize it in a systematic manner so that it could be understood easily. Generally, data is organized in tabular form as it is easy to read and understand.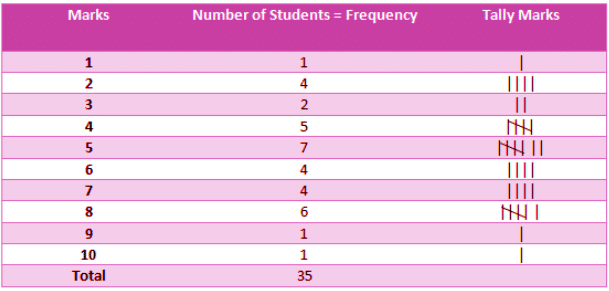
In this tabular form, we can easily understand that how many students get how much mark.
Try yourself: What is the definition of data handling?
Representative Values
There must be a particular value which represents the complete data. This is the average of the data. The average lies between the smallest and the largest number of data so it is called Central tendency of the group of data.
There are three types of central tendency of data-
- Arithmetic Mean
- Mode
- Median
Let us understand them in concise manner.
1. Arithmetic Mean
The mean is the average of the number of observations. To calculate mean we have to divide the sum of the values of the observations by the total number of observations.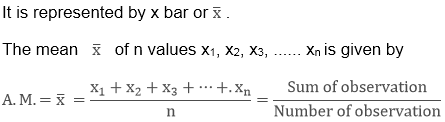
Example
The score of 8 students in science is given. Find the average score of the students. 25, 28, 23, 24, 29, 35, 42, 48
Solution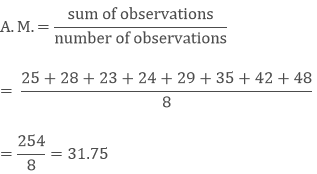
Range
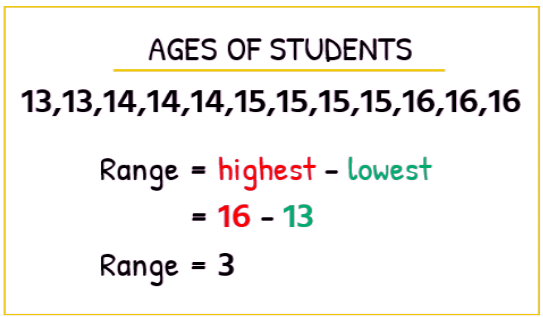
Arithmetic mean lies between the smallest and the largest observation. A range is a difference between the largest and the smallest observation.
Range = Largest Observation - Smallest Observation
Example If the age of the students in a class is given then what will be the range of the given students?
Try yourself: What is the arithmetic mean?
2. Mode
For a different type of requirements different central tendencies are used. Mode tells us the number of observation which occurs more frequently. The observation which occurs most of the time is called the Mode of that group.
Example
If we have the observation of average temperature in New Delhi for 12 months then find the month in which it has the maximum average temperature? What is the mode of the given observation?
Month | Average Temperature |
January | 18 |
February | 22 |
March | 24 |
April | 25 |
May | 25 |
June | 29 |
July | 27 |
August | 27 |
September | 27 |
October | 25 |
November | 21 |
December | 19 |
Sol: As you can see that the maximum average temperature is in the month of June.
Its mode will be 27 as it occurs more frequently i.e. three times.
Mode of a Large Number of Observations
If the number of observations is very large then we can convert the data in the tabular form using frequencies and tally marks. Then it will be easy to find the mode of the given data.
So, you can check the number of observations which has a large number of frequencies is the mode of that group.
Example
Find the mode of the data of scores obtained by students of class 7 in Sanskrit given below.
Score | Number of Students |
2 | 4 |
4 | 2 |
8 | 3 |
9 | 2 |
11 | 5 |
13 | 4 |
15 | 6 |
18 | 8 |
Sol: The mode is the 18 as the maximum number of students i.e. 8 students score 18.
3. Median
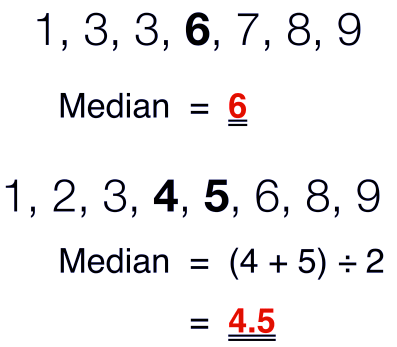
The middle value of the given number of the observations which divides it into exactly two parts is called Median.
To find the median, we have to arrange the data in ascending or descending order then find the middle value of the given number of observations that is the median of that group.
(a) If the number of observation is odd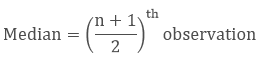
(b) If the number of observation is even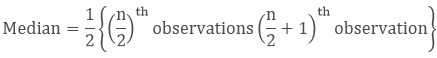
Example
Use of Bar Graphs with a Different Purpose
Bar graphs can be used for finding the measures of central tendency also, as we know the observation with the more frequency is the mode hence the bar with the tallest height must be the mode of the data.
Choosing a Scale
It is important to choose the scale according to the given data as the length of the bar depends upon the scale we choose.
Bar Graph
It is the representation of data with the use of bars of the same width and the length of bars depends upon the number of frequency.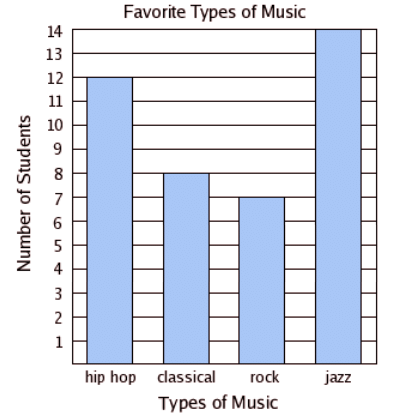
Here we can see that the highest number is 14 and the lowest number is 7 so we can take the scale of one. By the graph, we can observe that jazz is the most preferred form of music by the students.
Double Bar Graph
This is the same as the bar graph just the two bars are joined off to represent two data on the same graph. This is used to compare certain information.
Example
Represent the number of wild animals found in two states given below in double bar graph.
Wild Animals | Karnataka | Tamil Nadu |
Lion | 20 | 18 |
Tiger | 16 | 20 |
Elephant | 30 | 25 |
Rhino | 15 | 22 |
Zebra | 25 | 28 |
Sol: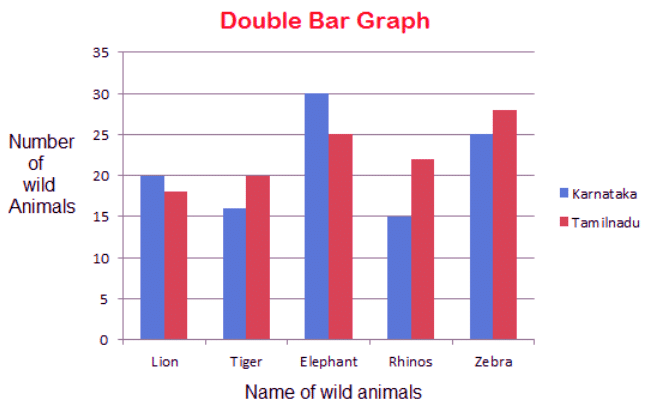
- Here we have chosen a scale of 5.
- The x-axis represents the name of wild animals.
- Y-axis represents the number of wild animals.
- The blue bar represents the number of animals in Karnataka.
- Pink bars represent the number of animals in Tamil Nadu.
This double bar graph is used to compare the number of animals in different states.
Try yourself: How is the median calculated when the number of observations is odd?
Probability
Probability is the study of uncertainty The uncertainty of any doubtful situation is measured by means of Probability.
This tells us the chance of happening some outcomes from the total possible outcomes.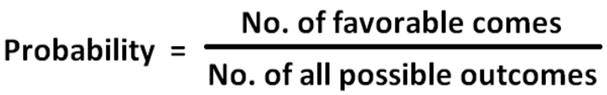
Example: If we throw a dice then what is the probability that we will get a 5?
Sol: 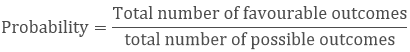
Favourable outcome = 1 (there is only one possibility of getting 5)
Total no. of possible outcomes = 6 (total six numbers are there on a dice)
Probability of getting 5 = 1/6


