Class 5 Maths Chapter 14 Important Question Answers - Chapter 12 - Smart Charts
Q1: Thee two graph below compare Car A and Care B. The left graph shows the relationship between age and value. The right graph shows the relationship between size and maximum speed. Use the graphs to determine whether each statement is ture or false, and explain your answer. The faster car is older.
Ans: Looking the both graphs, we can observe following things:
Car A : Newer and Slower
Car B : Older and Faster
Hence, as Car B is older and faster which means that the larger car is faster.
So, the given statement is True.
Q2: The number of ATMs of different banks in a city is shown below:
Draw a bar graph to represent the above information by choosing the scale of your choice.
Ans: Take Number of ATM on the vertical axis and name of Bank on horizontal axis.
Q3: The relation between dependent and independent variables is shown through a ________ .
Ans: The relation between dependent and independent variables is shown through a Graph.
Q4: Read the bar graph and answer the following questions:
Of which state were the minimum number of tickets sold?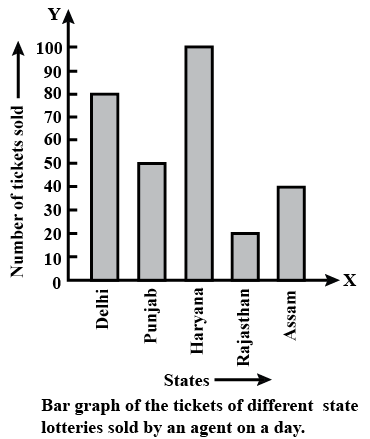
Ans: From the graph,
The number of Delhi lottery tickets sold by the agent is = 80.
The number of Punjab lottery tickets sold by the agent is = 50.
The number of Haryana lottery tickets sold by the agent is = 100.
The number of Rajasthan lottery tickets sold by the agent is = 20.
The number of Assam lottery tickets sold by the agent is = 40.
Then clearly, the minimum number of tickets sold were of the state Rajasthan.
Q5: Read the bar graph and answer the following question:
What was the number of commercial banks in 1977?
Ans: From the graph,
The number of commercial banks in 1969 is = 90.
The number of commercial banks in 1976 is = 100.
The number of commercial banks in 1977 is = 130.
The number of commercial banks in 1978 is = 140.
The number of commercial banks in 1979 is = 140.
The number of commercial banks in 1980 is = 150.
The number of commercial banks in 1981 is = 190.
The number of commercial banks in 1982 is = 210.
The number of commercial banks in 1983 is = 230.
Then clearly, the number of commercial banks in 1977 was 130.
Q6: Read the bar graph and answer the following questions: The information given by the bar graph is the number of tickets of different state lotteries sold by an agent on a day. For the above statement, type 1 if it is true and type 0 if it is false.
Ans: The bar graph gives the information about the number of tickets of different state lotteries sold by an agent on a day. Hence answer is 1.
Q7: Study the given graph and complete the table below.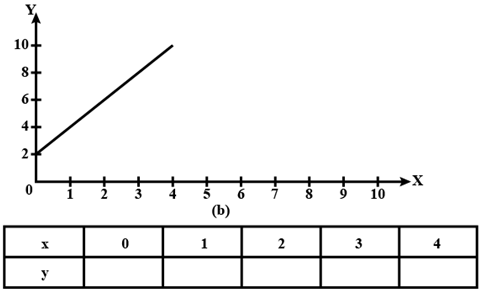
Ans: After observing the graph, we conclude that,
For x = 0 , y = 2
For x = 1 , y = 4
For x = 2 , y = 6
For x = 3 , y = 8
For x = 4 , y = 10
Hence, the complete table is as shown.
Q8: Observe the toothpick pattern given below: make a graph by taking the pattern numbers on the horizontal axis and the number of toothpicks on the vertical axis. Make the horizontal axis from 0 to 10 and the vertical axis from 0 to 30.
Ans: The above graph is plotted by the pattern numbers on the horizontal axis and the number of toothpicks on the vertical axis.
|
29 videos|167 docs|43 tests
|

|
Oct 24, 2024 Last updated |

|
Explore Courses for Class 5 exam
|
|
Viva Questions
,Objective type Questions
,practice quizzes
,video lectures
,Class 5 Maths Chapter 14 Important Question Answers - Chapter 12 - Smart Charts
,Class 5 Maths Chapter 14 Important Question Answers - Chapter 12 - Smart Charts
,Exam
,study material
,Previous Year Questions with Solutions
,Important questions
,Sample Paper
,past year papers
,Extra Questions
,Class 5 Maths Chapter 14 Important Question Answers - Chapter 12 - Smart Charts
,Free
,ppt
,mock tests for examination
,MCQs
,Semester Notes
,Summary
,shortcuts and tricks
;


Important Questions: Smart Charts Free PDF Download
Importance of Important Questions: Smart Charts
Important Questions: Smart Charts Notes
Important Questions: Smart Charts Class 5
Study Important Questions: Smart Charts on the App
|
© EduRev
|
Education Revolution
|


Follow Us
|