Important Formula: Line Charts | Quantitative Aptitude for SSC CGL PDF Download
About Line Chart
Line graphs depict fluctuations in data through ascending and descending lines. They serve as a tool for comparing various events, situations, and information.
Formulas for Line Chart

Types of Line Chart
- Data Series: In a line chart, data is presented as a sequence of data points, with each point corresponding to a specific value at a particular moment in time or along a continuous scale. These points are linked by straight lines to construct the chart.
- X-Axis and Y-Axis: Line charts feature two axes—the horizontal X-axis and the vertical Y-axis. The X-axis commonly signifies the independent variable, like time, while the Y-axis represents the dependent variable, which can take on any numerical value.
- Data Points: Every data point on the chart comprises a pair of values: one for the X-coordinate (horizontal position) and one for the Y-coordinate (vertical position). The X-coordinate determines the point's location along the X-axis, while the Y-coordinate dictates its position along the Y-axis.
- Line Segments: The data points on the line chart are linked by line segments, offering a visual depiction of the data's trend or pattern. A connected line generally implies a smooth transition between data points.
- Trends and Patterns: Line charts are especially effective for illustrating trends in data. An upward-sloping line signifies increasing values over time or along the X-axis, whereas a downward-sloping line indicates decreasing values. A horizontal line signals no change, and variations in the line unveil patterns or cycles in the data.
- Title and Labels: Typically, a line chart includes a title and labels for both the X-axis and Y-axis, providing context and aiding the viewer in comprehending the displayed data.
How to make Line Chart?
To draw a line chart you must follow these steps:
- Use the data from the data-table to choose a suitable scale.
- Draw and label the scale on the vertical (y-axis) and horizontal (x-axis) axes.
- List each item and place the points on the graph.
- Join the points with line segments.

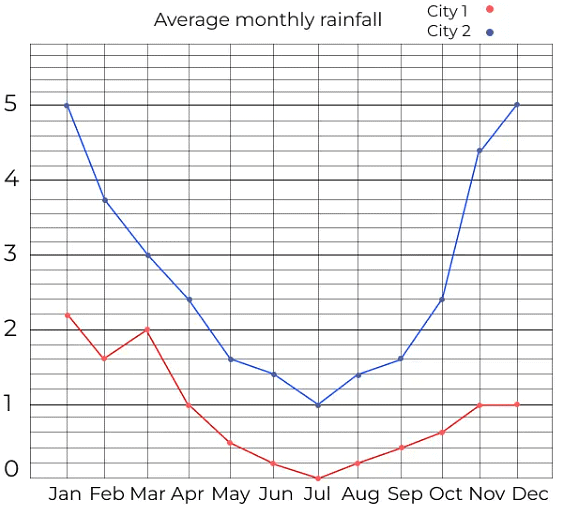
The above diagram shows the line graph of the average monthly rainfall of two cities (City 1 and City 2).
We can extract information from the above line graph and answer the questions accordingly.
Examples
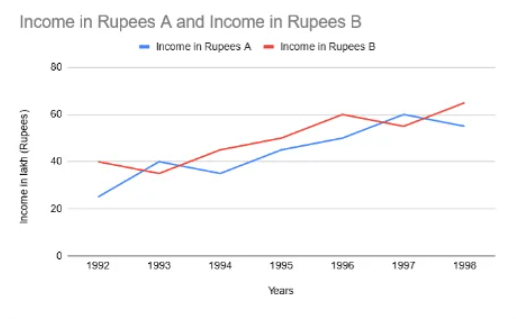
Study the following graph carefully and answer the questions given below (Profit is taken as the % of expenditure.)
Example 1: Calculate how much percent income of A was more or less than the income of B in the year 1996?
(a) 12.32%
(b) 13.25%
(c) 14.25%
(d) 16.66%
Ans: (d)
Income of A in 1996 = 50
Income of B in 1996 = 60
Clearly B has higher income.
Percentage less than B = (10 / 60) * 100
= 100/ 6 = 16.66%
Example 2: What is the average of the income of A and B together in the years 19921 1993 and 1994?
(a) 35
(b) 36
(c) 37
(d) 48
Ans: (c)
Income of A = 22 + 40 +38 = 100
Income of B = 40 + 38 + 44 = 122
Average of income of A and B = (100 + 122 ) / 6 = 37
Example 3: If in the year 1995, company ‘B’ had a profit of 25%, what approximately was its expenditure in the year 1995?
(a) Rs. 22 lakhs
(b) Rs. 29 lakhs
(c) Rs. 40 lakhs
(d) Rs. 27 lakhs
Ans: (c)
For company ‘B’ profit = 25%. Income of company B = 50 lakh in 1995
Required expenditure = 50/1.25 = 40 lakh
Example 4: If the expenditure of company B in 1997 is Rs. 50 lakhs, the percent profit earned by both the companies A and B in 1997 is equal, then what is the amount of profit earned by company A in 1997 (approximately)?
(a) Rs. 5 lakhs
(b) Rs. 4.5 lakhs
(c) Rs. 5.5 lakhs
(d) Rs. 6.2 lakhs
Ans: (c)
Income of company B in 1997 = 55 lakh.
Expenditure of company B in 1997 = 50 lakh.
% profit = 10%
Expenditure = 60/1.1
= 54.5 ⇒ amount of profit = 60 – 54.5 = 5.5 lakh
Example 5: What would be the ratio of income of company B in 1996 to the income of company A in 1993?
(a) 9 : 10
(b) 10 : 9
(c) 3 : 2
(d) 15 : 13
Ans: (c)
Income of Company B in 1996 = 60 lakh.
Income of company A in 1993 = 40 lakh.
Required ratio = 60/40 = 3 : 2
|
342 videos|249 docs|185 tests
|


