Tips and Tricks: Pie Charts | Quantitative Aptitude for SSC CGL PDF Download
Definition
A pie chart is a visual representation of data presented in a circular graph. The circle is segmented into slices, where each slice corresponds to a specific category. The magnitude of each slice is directly proportional to the quantity it signifies.
Pie Chart Tips, Tricks and Shortcuts
 Pie charts serve as a widely used data visualization method in data interpretation.Here are some strategies for tackling pie chart queries:
- Scrutinize the pie chart data attentively: If the data distribution is provided in percentages, multiply the given percentage by the total data amount and divide by 100 to obtain the actual value.
- Keep in mind that a complete circle encompasses 360 degrees: In a pie chart, each sector signifies a specific percentage of the overall data, calculated using the formula: percentage of a data = (given data/total of all data) x 100.
- Compute the central angle for each sector using the formula: central angle of a data = (given data/total of all data) x 360 degrees.
- Engage in solving pie chart problems with provided solutions and explanations to enhance proficiency.
Uses of Pie Chart
Pie charts function as a charting method employed to illustrate fractions as components of a whole. They are frequently utilized for data comparison, aiding in the analysis of the relative sizes of different data sets. Pie charts are particularly suitable for handling discrete data.
Here are various applications of pie charts:
- Illustrating percentages in relation to a complete entity.
- Depicting sample data with distinct categories for data points.
- Contrasting growth areas in business, encompassing turnover, profit, and exposure.
- Representing categorical data effectively.
- Displaying a student's performance in a test.
Examples
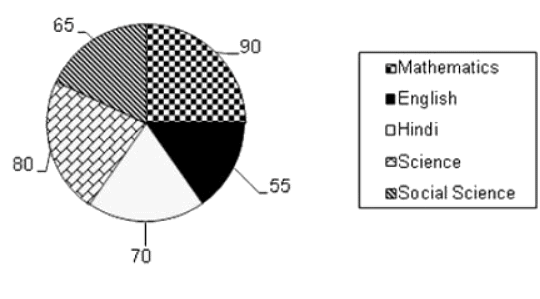
Refer to the pie chart given below and answer the questions that follow.
The given pie chart shows the marks scored by a students of G.D.Goenka School in different subjects- English, Hindi, Mathematics, Science and Social Science in an examination. The values given are in degrees.
Assumption: Total marks obtained in the examination are 900.
Example 1: The Marks scored by the student of G.D.Goenka School in English and Mathematics is less than the marks scored in Science and Hindi by
(a) 5%
(b) 4.33%
(c) 3.33%
(d) 6%
Ans: (c)
Marks scored in English and Mathematics = (55 + 90 ) / 360 x 900 = 362.5
Marks scored in Hindi and Science = (70 + 80) / 360 x 900 = 375
Percent decrease = 12.5 / 375 x 100 = 3.33
Example 2: If the total marks of student of G.D.Goenka School were 3000, then marks in Mathematics would be
(a) 800
(b) 750
(c) 850
(d) 900
Ans: (b)
Marks obtained in Mathematics would be = 90 / 360 x 3000 = 750
Example 3: If the marks scored by the student of G.D.Goenka School are 137.5, then the subject is
(a) English
(b) Hindi
(c) Mathematics
(d) Science
Ans: (a)
Going by the options, marks scored in English = 55 /360 x 900 = 137.5
Example 4: What are total marks scored in Social Science and English by students of G.D.Goenka School?
(a) 300
(b) 350
(c) 400
(d) 450
Ans: (a)
Angle of English sector is 55° and angle of Social Science sector is 65°.
So sum of angles is 120°.
Sum of marks =( 120° x 900) / 360 = 300.
Example 5: The difference of marks scored in Social Science and Science by students of G.D.Goenka School is
(a) 37.5
(b) 40
(c) 20
(d) 15
Ans: (a)
Angle of Science sector is 800 and angle of Social Science sector is 650. So difference of angle is 150. Difference of marks = (150 x 900 ) / 3600 = 37.5
|
314 videos|170 docs|185 tests
|
|
314 videos|170 docs|185 tests
|

|
Explore Courses for SSC CGL exam
|

|


