Solved Examples: Table Charts | Quantitative Aptitude for SSC CGL PDF Download
| Table of contents |

|
| Definition |

|
| What is Table Chart? |

|
| Types of Table Chart |

|
| Solved Examples |

|
Definition
A table chart, alternatively referred to as a data table, presents data in a visual format with organized rows and columns. In this representation, each row usually signifies a data point or record, and each column corresponds to a variable or attribute.

What is Table Chart?
A mathematical line chart is a visual depiction of mathematical functions or equations presented on a two-dimensional plane. Its purpose is to illustrate the correlation between two variables, typically an independent one (such as time, distance, or input) and a dependent one (like temperature, velocity, or output). Employed across diverse disciplines such as mathematics, physics, engineering, economics, and others, mathematical line charts serve as a tool to showcase and examine continuous data trends and mathematical connections.
Types of Table Chart
Various types of table charts are available for representing data, including the following commonly used ones:
- Basic Data Table:
- Description: A conventional data table structuring information into rows and columns, with each row representing a data point and each column denoting an attribute or variable.
- Use Cases: Applied for presenting diverse structured data, such as financial reports, survey findings, and data listings.
- Pivot Table:
- Description: A specialized table enabling users to interactively summarize, aggregate, and manipulate data. Pivot tables often feature capabilities like filtering, grouping, and dynamic calculations.
- Use Cases: Particularly useful for summarizing and analyzing extensive datasets, especially in business and financial analysis.
- Comparison Table:
- Description: Tailored for comparing multiple items, like products, services, or options. Rows typically represent items, and columns list attributes or features for comparison.
- Use Cases: Commonly employed in scenarios involving product comparisons, feature matrices, and decision-making.
- Matrix Table:
- Description: A table chart structured as a matrix, with rows and columns. Matrix tables are utilized to exhibit relationships between two sets of items, often involving binary (yes/no) or categorical data.
- Use Cases: Frequently used in survey analysis, contingency tables, and cross-tabulations.
- Time-Series Table:
- Description: Tailored to display time-series data, where one of the columns represents time intervals (e.g., days, months, years). Time-series tables can encompass metrics, values, or events over time.
- Use Cases: Suitable for tracking historical data, identifying trends, and monitoring performance metrics over time.
Solved Examples
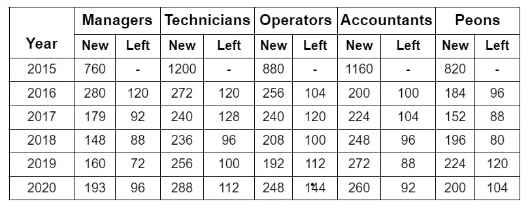
Example 1: The following table shows the number of new employees added in Kia Motors India, in different categories and also the number of employees from these categories who left the company every year.
What is the difference between the total number of Technicians added to the Company and the total number of Accountants added to the Company during the years 2016 to 2020?
(a) 128
(b) 112
(c) 96
(d) 88
Ans: (d)
Required difference
= (272 + 240 + 236 + 256 + 288) - (200 + 224 + 248 + 272 + 260)
= 88.
Example 2: The following table shows the number of new employees added in Kia Motors India, in different categories and also the number of employees from these categories who left the company every year.
What was the total number of Peons working in the Company in the year 2019?
(a) 1312
(b) 1192
(c) 1088
(d) 968
Ans: (b)
Total number of Peons working in the Company in 2019
= (820 + 184 + 152 + 196 + 224) - (96 + 88 + 80 + 120) = 1192.
Example 3: The following table shows the number of new employees added in Kia Motors India, in different categories and also the number of employees from these categories who left the company every year. For which of the following categories the percentage increase in the number of employees working in the Company from 2015 to 2020 was the maximum?
(a) Managers
(b) Technicians
(c) Operators
(d) Accountants
Ans: (a)
Number of Managers working in the Company:
In 2015 = 760.
In 2020 = (760 + 280 + 179 + 148 + 160 + 193) - (120 + 92 + 88 + 72 + 96)= 1252.
Therefore, the Percentage increase in the number of Managers
(1252 - 760) / 760 * 100 = 64.74%
Number of Technicians working in the Company:
In 2015 = 1200.
In 2020 = (1200 + 272 + 240 + 236 + 256 + 288) - (120 + 128 + 96 + 100 +112) = 1936.
Therefore, the Percentage increase in the number of Technicians
{(1936 - 1200 ) / 1200} * 100 = 61.33%
Number of Operators working in the Company:
In 2015 = 880.
In 2020 = (880 + 256 + 240 + 208 + 192 + 248) - (104 + 120 + 100 + 112 + 144) = 1444.
Therefore, the Percentage increase in the number of Operators
(1444 - 880 / 880 ) * 100 = 64.09%
Number of Accountants working in the Company:
In 2015 = 1160.
In 2020 = (1160 + 200 + 224 + 248 + 272 + 260) - (100 + 104 + 96 + 88 + 92) = 1884.
Therefore, the Percentage increase in the number of Accountants
(1884 - 1160 / 1160 ) * 100 = 62.14%
Number of Peons working in the Company:
In 2015 = 820.
In 2020 = (820 + 184 + 152 + 196 + 224 + 200) - (96 + 88 + 80 + 120 + 104) = 1288.
Therefore, the Percentage increase in the number of Peons
(1288 - 820 / 820 ) * 100 = 57.07%
Clearly, the percentage increase is maximum in the case of Managers.
Example 4: The following table shows the number of new employees added in Kia Motors India, in different categories and also the number of employees from these categories who left the company every year.
What is the pooled average of the total number of employees of all categories in the year 2017?
(a) 1325
(b) 1195
(c) 1265
(d) 1235
Ans: (b)
Total number of employees of various categories working in the Company in 2017 are:
Managers = (760 + 280 + 179) - (120 + 92) = 1007.
Technicians = (1200 + 272 + 240) - (120 + 128) = 1464.
Operators = (880 + 256 + 240) - (104 + 120) = 1152.
Accountants = (1160 + 200 + 224) - (100 + 104) = 1380.
Peons = (820 + 184 + 152) - (96 + 88) = 972.
Therefore, Pooled average of all the five categories of employees working in the Company in 1997 = 1/5 x (1007 + 1464 + 1152 + 1380 + 972)
= 1/5 x (5975)
= 1195.
Example 5: The following table shows the number of new employees added in Kia Motors India, in different categories and also the number of employees from these categories who left the company every year.
During the period between 2015 and 2020, the total number of Operators who left the Company is what percent of the total number of Operators who joined the Company?
(a) 19%
(b) 21%
(c) 27%
(d) 29%
Ans: (d)
Total number of Operators who left the Company during 2015 - 2020
= (104 + 120 + 100 + 112 + 144)
= 580.
Total number of Operators who joined the Company during 2015 - 2020
= (880 + 256 + 240 + 208 + 192 + 248
= 2024.
Therefore, Required Percentage
= (580/2024) x 100% = 28.66% ~= 29%.
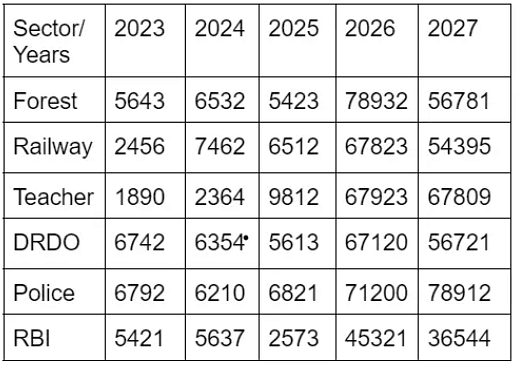
Example 6: The congress government pledged to provide jobs for young people during the election. Below is a full breakdown of the employment that has been offered over the years in the Forest, Railway, Teacher, DRDO, Police, and RBI. Answer the following questions after carefully reviewing the table.
Calculate the difference between the average of the total number of Jobs provided in Forest over the years and the average of the total number of Jobs provided in the RBI over the years by the Congress government?
(a) 1009
(b) 11563
(c) 12903
(d) 11892
Ans: (b)
Average of total number of Job provided in Forest sector over the years
153311/5 = 30662.2
the average of total number of Job provided in RBI sector over the years
95496/5 = 19099.2
Required difference = 30662.2 – 19099.2 = 11563.2 = 11563.
Example 7: The congress government pledged to provide jobs for young people during the election. Below is a full breakdown of the employment that has been offered over the years in the Forest, Railway, Teacher, DRDO, Police, and RBI. Answer the following questions after carefully reviewing the table.
The Job provided by the Congress government in the DRDO sector in 2023 is approximately what percent of the total number of Job provided in all the sectors in that year?
(a) 22.23 %
(b) 34.54%
(c) 19.90%
(d) 23. 29%
Ans: (d)
The total number of Job provided in the DRDO sector in 2023 = 6742
Total number of Job provided in all the sectors is 2023 = 28944
The required percentage =
= 6742 x 100/28944
= 23.29%
Example 8: The congress government pledged to provide jobs for young people during the election. Below is a full breakdown of the employment that has been offered over the years in the Forest, Railway, Teacher, DRDO, Police, and RBI. Answer the following questions after carefully reviewing the table. Determine the increase in the percentage of the Job provided in the RBI Sector is 2023 over the previous year?
(a) 19.78%
(b) 12.65%
(c) 3.9%
(d) 11.98%
Ans: (c)
The Job in RBI sector by Congress government in 2024 = 5637
The Job in RBI sector by Congress government in 2023 = 5421
The required percentage
= ( 5637-5421 ) x (100/5421)
= 3.9% approx
Example 9: The congress government pledged to provide jobs for young people during the election. Below is a full breakdown of the employment that has been offered over the years in the Forest, Railway, Teacher, DRDO, Police, and RBI. Answer the following questions after carefully reviewing the table. What is the average number Jobs provided in all sectors together in 2027?
(a) 58527
(b) 58127
(c) 59627
(d) None of these
Ans: (a)
The average number of Jobs provided in all sectors together in 2027
= 351162/6
= 58527
Example 10: The congress government pledged to provide jobs for young people during the election. Below is a full breakdown of the employment that has been offered over the years in the Forest, Railway, Teacher, DRDO, Police, and RBI. Answer the following questions after carefully reviewing the table.
Calculate the total number of Job provided in Police is approximately what percent of the number of Job provided in the RBI sector in 2023?
(a) 121.65%
(b) 114. 55%
(c) 108.45%
(d) 84.65%
Ans: (b)
Job provided in the Police department in 2024 = 6210
Job provided in the RBI department in 2023 = 5421
The required percentage
= 6120 x (100/5421)
= 114.55% approximately
|
342 videos|249 docs|185 tests
|


