Important Formula: Table Charts | Quantitative Aptitude for SSC CGL PDF Download
Definition
Table charts are precise tools for interpreting data, providing customers with well-defined and fixed information. They offer exact and accurate answers to questions, ensuring clarity in data presentation.
Formulas for Table Chart
Incorporating mathematical formulas enhances the effectiveness of table charts. Here are various ways to employ formulas within table charts:
- Basic Arithmetic Operations:
- Summation: Utilize the SUM formula to determine the total of a column or row by adding up individual cell values.
- Averages: Calculate the average of a set of values within a column or row using the AVERAGE formula.
- Subtraction and Multiplication: Perform subtraction and multiplication operations as required to generate new values based on existing data.
- Statistical Analysis:
- Standard Deviation: Determine the standard deviation of a dataset using the appropriate formula to assess the dispersion of data.
- Percentages: Utilize formulas to express values as percentages of a whole, facilitating comparisons of proportions.
- Conditional Formulas:
- IF Statements: Apply conditional formulas to execute actions based on specific conditions. For instance, highlight cells meeting particular criteria or execute calculations only under specific conditions.
- Date and Time Calculations:
- Date Differences: Calculate the difference between two dates to monitor durations or analyze time-related data.
- Date Functions: Employ date functions to extract specific components (e.g., year, month, day) from date and time values.
Formulas for Table chart
Key Points
- The cells within a table contain various kinds of data, such as a student's grades, a company's income, a firm's production, expenses on different items, and more.
- Typically, the initial row and column in the table represent the titles or headings.
- The complexity of questions related to tables can vary, being either more advanced or simpler compared to other types of graphs.
- This largely depends on the information provided in the table and how the questions are formulated.
Example: Formulas serve as the fundamental element for proficient data analysis and visualization in table charts. Through the utilization of mathematical calculations, you have the capability to convert your table charts into dynamic instruments for informed decision-making based on data. Whether dealing with financial figures, scientific data, or any other dataset, the adept application of formulas is essential for realizing the complete potential of table charts.
Examples
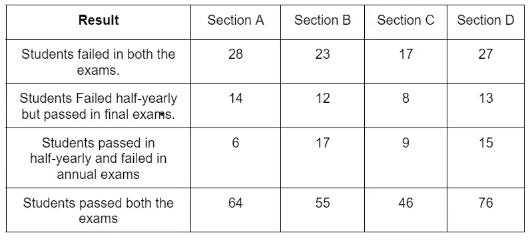
Example 1: Army Public School, Shankar Vihar has four sections A, B, C, D of Class XI students.

If the number of students passing an examination be considered a criterion for comparison of the difficulty level of two examinations, which of the following statements is true in this context?
(a) Half-yearly examinations were more difficult.
(b) Annual examinations were more difficult.
(c) Both the examinations had almost the same difficulty level.
(d) The two examinations cannot be compared for difficulty level.
Ans: (c)
Number of students who passed half-yearly exams in the school
= (Number of students passed in half-yearly but failed in annual exams) + (Number of students passed in both exams)
= (6 + 17 + 9 + 15) + (64 + 55 + 46 + 76) = 288.
Also, the Number of students who passed annual exams in the school
= (Number of students who failed in half-yearly but passed in annual exams) + (Number of students passed in both exams)
= (14 + 12 + 8 + 13) + (64 + 55 + 46 + 76) = 288.
Since, the number of students passed in half-yearly = the number of students passed in annual exams. Therefore, it can be inferred that both the examinations had almost the same difficulty level. Thus Statements (a), (b), and (d) are false and Statement (c) is true.
Example 2: Army Public School, Shankar Vihar has four sections A, B, C, D of Class XI students.

How many students are there in Class IX in the school?
(a) 336
(b) 189
(c) 335
(d) 430
Ans: (d)
Since the classification of the students on the basis of their results and sections form independent groups, so the total number of students in the class:
= (28 + 23 + 17 + 27 + 14 + 12 + 8 + 13 + 6 + 17 + 9 + 15 + 64 + 55 + 46 + 76)
= 430.
Example 3: Army Public School, Shankar Vihar has four sections A, B, C, D of Class XI students.

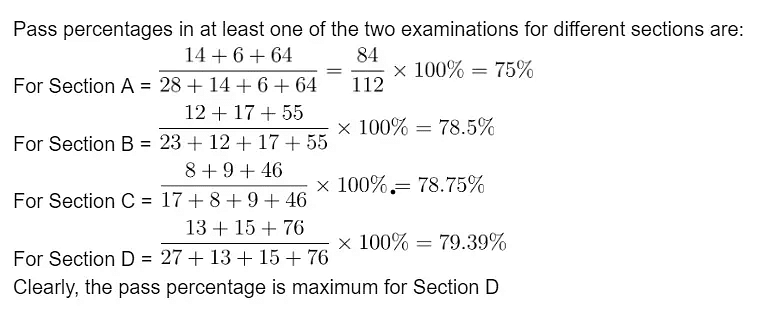
Which section has the maximum pass percentage in at least one of the two examinations?
(a) A section
(b) B section
(c) C section
(d) D section
Ans: (d)
Example 4: Army Public School, Shankar Vihar has four sections A, B, C, D of Class XI students.

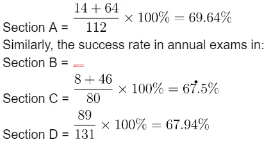
Which section has the maximum success rate in the annual examination?
(a) A section
(b) B section
(c) C section
(d) D section
Ans: (a)
Total number of students passed in annual exams in a section
= [(No. of students failed in half-yearly but passed in annual exams) + (No. of students passed in both exams) ] in that section The success rate in annual exams in 14 + 64 x 100% = 69.64%
Clearly, the success rate in the annual examination is maximum for Section A.
Example 5: Army Public School, Shankar Vihar has four sections A, B, C, D of Class XI students.

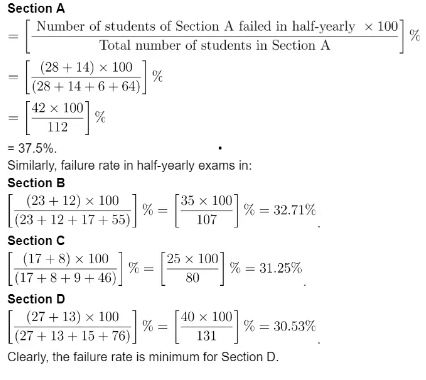
Which section has the minimum failure rate in the half-yearly examination?
(a) A section
(b) B section
(c) C section
(d) D section
Ans: (d)
Total number of failures in half-yearly exams in a section [ (Number of students failed in both exams) + (Number of students failed in half-yearly but passed in Annual exams)] in that section Therefore Failure rate in half-yearly exams in
|
314 videos|170 docs|185 tests
|
|
314 videos|170 docs|185 tests
|

|
Explore Courses for SSC CGL exam
|

|


