12 Minute Test: Pie Charts | Logical Reasoning (LR) and Data Interpretation (DI) - CAT PDF Download

The CAT exam demands quick thinking and efficient time management, especially in the Data Interpretation and Logical Reasoning (DILR) section, where interpreting charts under time pressure is crucial. By practising with this focused test, you’ll build the skills needed to tackle similar questions on the actual exam, boosting your confidence and performance.
Benchmarking Performance
This test has two sets of Pie Chart questions, each of which you should aim to solve in 12 minutes.
If you solve within 12 minutes: You’re meeting the baseline for a top percentile. Now aim for 10-11 minutes/set to breach the 100-percentile barrier (3+ sets in 40 minutes).
If you exceed 12 minutes: Focus on identifying gaps (e.g., misinterpreting rules, slow calculations).
Only after thorough self-effort should you review solutions to pinpoint what you missed, ensuring maximum learning and preparation for the CAT’s demanding DI-LR section.
Good luck!
Set 1
Directions: The following pie chart depicts the percentage breakup of power distribution to four states by various electric power companies of India in a year.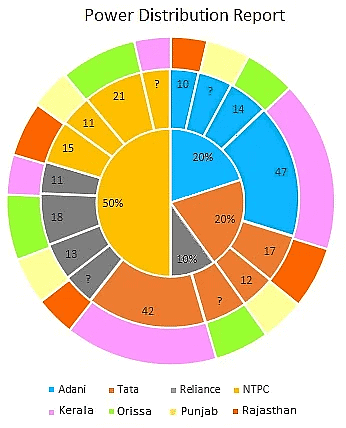
The second layer of the pie chart depicts the megawatt distribution (in thousands) by the given four power companies. It is also known that these companies distribute power only to the state mentioned and the power distributed to any state by a company is an integral multiple of 1000. These 4 states are mentioned in the outermost layer of the pie chart and get power from those 4 companies only.
Q1: What is the least megawatt that could be distributed by NTPC to Kerala?
A: 1,22,000
B: 1,44,000
C: 1,53,000
D: 1,63,000
 View Answer
Ans: Option D
From the given pie chart, we can depict the following information.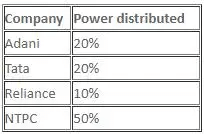 Let the power distributed by Reliance to Rajasthan be p, Adani to Punjab be q, Tata to Orissa be r and NTPC to Kerala be s.
 Total power distributed = t
From pie chart, total power distributed by NTPC = 50% of t
47 + s = 0.5t
s = 0.5t - 47
Also, r = 0.2t - 71, q = 0.2t - 71 and p = 0.1t - 42 The power generated cannot be negative, thus limiting conditions by equating to 0.Therefore,
0.1t = 42
t = 420 (minimum value for which p will be positive)
0.2t = 71
t = 355 (minimum value for which q and r will be positive)
0.5t = 47
t = 94 (minimum value for which s will be positive)
Therefore, the least value of t will be 420.
Thus, the least megawatt that NTPC could have distributed to Kerala = 0.5t - 47 = 0.5 × 420 - 47 = 210 - 47 = 163
Therefore, the least megawatt that NTPC could have distributed to Kerala is 163 thousand, i.e. 1,63,000 MW.
Q2: The state(s) to which maximum megawatts of power is distributed, if the total power distributed by all companies is 500 megawatt (in thousands), is/are
A: Rajasthan
B: Kerala
C: Punjab and Orissa
D: Kerala and Orissa
View Answer From the given pie chart, we can depict the following information. Let the power distributed by Reliance to Rajasthan be p, Adani to Punjab be q, Tata to Orissa be r and NTPC to Kerala be s.
 Total power distributed = tFrom pie chart, total power distributed by NTPC = 50% of t
47 + s = 0.5t
s = 0.5t - 47
Also, r = 0.2t - 71, q = 0.2t - 71 and p = 0.1t - 42 Total power distributed by all companies is 500 i.e. t = 500 MW (in thousands)From the given information, total power distributed to Rajasthan
  MW (in thousands)
Total power distributed to Punjab  MW (in thousands)
Total power distributed to Orissa  MW (in thousands)
Total power distributed to Kerala  MW (in thousands)
Among the four states, the maximum MW of power is distributed to Kerala.
Q3: What percentage of the total power distributed by Tata to Rajasthan is the total power distributed by Reliance to Punjab?
A: 76.5%
B: 65.7%
C: 56.7%
D: 67.5%
View Answer From the given pie chart, we can depict the following information.
 Let the power distributed by Reliance to Rajasthan be p, Adani to Punjab be q, Tata to Orissa be r and NTPC to Kerala be s.
 Total power distributed = tFrom pie chart, total power distributed by NTPC = 50% of t
47 + s = 0.5t
s = 0.5t - 47
Also, r = 0.2t - 71, q = 0.2t - 71 and p = 0.1t - 42
 Total power distributed by Tata to Rajasthan = 17,000 MWTotal power distributed by Reliance to Punjab = 13,000 MW
x% of 17,000 = 13,000
x%
 Therefore, x = 76.5%
Q4: If the power distributed to Kerala is six times the power distributed to Rajasthan, then the power distributed to Orissa will be
A: 88,000 MW
B: 98,000 MW
C: 10,820 MW
D: 11, 250 MW
View Answer Ans: Option A
From the given pie chart, we can depict the following information. Let the power distributed by Reliance to Rajasthan be p, Adani to Punjab be q, Tata to Orissa be r and NTPC to Kerala be s.
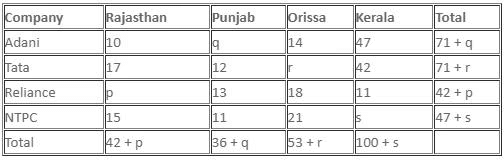 Total power distributed = tFrom pie chart, total power distributed by NTPC = 50% of t
47 + s = 0.5t
s = 0.5t - 47
Also, r = 0.2t - 71, q = 0.2t - 71 and p = 0.1t - 42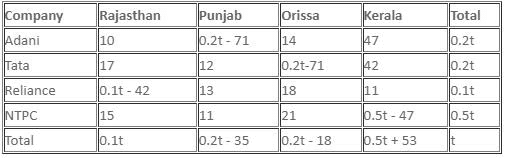 Total power distributed to Kerala = 0.5t + 53Total power distributed to Rajasthan = 0.1t
Given, the power distributed to Kerala is six times the power distributed to Rajasthan.


 Then, power distributed to Orissa

 Thus, power distributed to Orissa = 88,000 MW
Set 2
Directions: The breakdown of the students in a university by subject major is given in the polar pie chart. The bar chart shows the number of students who major in physics by geographic location.
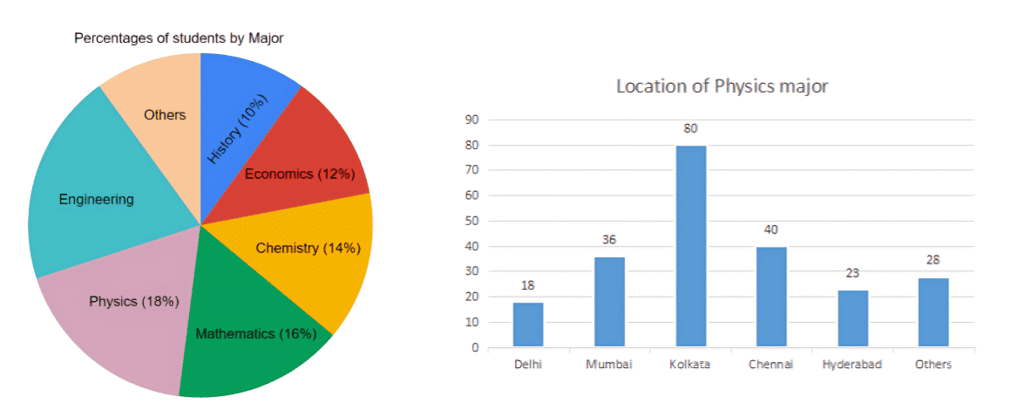
Q1: How many students major in chemistry?
A. 200
B. 175
C. 170
D. 190
E. 180
View Answer Ans: Option B
Sum of known percentages:
18% + 16% + 14% + 12% + 10% = 70%
This means Engineering and Others together account for the remaining 30% (100% - 70%).
The question asks how many students major in Chemistry, with the options:
A. 200
B. 175
C. 170
D. 190
E. 180
Chemistry majors are 14% of the total number of students (T):
Number of Chemistry majors = 0.14 x T
We test each option to find T:
- Option A: 200
0.14 x T = 200
T = 200 / 0.14 = 1428.57 (not a whole number) - Option B: 175
0.14 x T = 175
T = 175 / 0.14 = 1250 (whole number) - Option C: 170
0.14 x T = 170
T = 170 / 0.14 = 1214.29 (not a whole number) - Option D: 190
0.14 x T = 190
T = 190 / 0.14 = 1357.14 (not a whole number) - Option E: 180
0.14 x T = 180
T = 180 / 0.14 = 1285.71 (not a whole number)
Option B (175) yields a whole number total (T = 1250), making it the most likely answer. Let’s verify this using the bar chart.
Verify with the Bar Chart (Location of Physics Major)
Total number of Physics majors:
18 + 36 + 80 + 40 + 23 + 28 = 225
From the pie chart, Physics majors are 18% of the total number of students (T):
Number of Physics majors = 0.18 x T
Using T = 1250 (from Option B):
0.18 x 1250 = 225
The bar chart confirms that there are 225 Physics majors, which matches the calculation based on T = 1250.
This consistency supports that our total number of students is correct.
Therefore, using T = 1250:
- Chemistry (14%): 0.14 x 1250 = 175, which matches Option B.
Q2: If the proportion of physics majors who are from Delhi is the same as the proportion of engineering majors who are from Delhi, how many engineering majors are from Delhi?
A. 22
B. 26
C. 18
D. 20
E. 24
View Answer Ans: Option D
Step 1: Total number of students in the university
From the pie chart, Physics majors = 18% of total students.
From the bar chart, number of Physics majors = 225.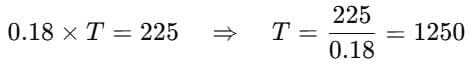 So, total number of students = 1250.Step 2: Number of Engineering majors
Engineering majors = 20% of 1250
So, total Engineering majors = 250.
Step 3: Proportion of Physics majors from Delhi
Physics majors from Delhi = 18 (from bar chart).
Total Physics majors = 225.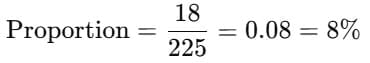
So, 8% of Physics majors are from Delhi.
Step 4: Apply the same proportion to Engineering
Engineering majors = 250.
Delhi Engineering majors = 8% of 250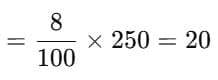
Q3: 12% of all students are from Chennai. What is the largest possible percentage of economics students that can be from Chennai, rounded off to the nearest integer?
A. 73%
B. 77%
C. 75%
D. 71%
E. 69%
View Answer Ans: Option A
Students from Chennai
12% of all students are from Chennai:
0.12 × 1250 = 150 students
Step 1: Calculate the Number of Economics Students
Economics students are 12% of the total:
0.12 × 1250 = 150 Economics students
Step 2: Determine the Largest Possible Number of Economics Students from Chennai
We need to find the maximum number of Economics students who can be from Chennai, given that there are 150 students from Chennai in total across all majors. To maximize the number of Economics students from Chennai, we minimize the number of students from Chennai in all other majors (Physics, Mathematics, Chemistry, History, Engineering, and Others).
Minimum Contribution from Other Majors
- Physics: From the bar chart, 40 Physics students are from Chennai (out of 225 total Physics students). This number is fixed.
- Mathematics: 16% of 1250 = 200 students. The minimum number from Chennai can be 0 (hypothetically, to maximize Economics).
- Chemistry: 14% of 1250 = 175 students. Minimum from Chennai = 0.
- History: 10% of 1250 = 125 students. Minimum from Chennai = 0.
- Engineering and Others: 30% of 1250 = 375 students. Minimum from Chennai = 0.
Total students from Chennai (excluding Economics):
- Physics: 40
- Others (Mathematics, Chemistry, History, Engineering, Others): Minimum = 0
Minimum number of Chennai students in non-Economics majors = 40 (from Physics).
Total students from Chennai = 150.
Maximum number of Economics students from Chennai:
150 - 40 = 110
Step 3: Calculate the Percentage of Economics Students from Chennai
Total Economics students = 150.
Maximum Economics students from Chennai = 110.
Percentage of Economics students from Chennai:
(110 / 150) × 100 = 73.333…%
Step 4: Round to the Nearest Integer
73.333…% rounds to 73%.
Step 5: Verify Against Answer Choices
The options are:
A. 73%
B. 77%
C. 75%
D. 71%
E. 69%
Our calculated percentage (73%) matches option A. Let’s double-check by considering if we can increase the number further:
- The total from Chennai is fixed at 150. If more than 40 students from other majors are from Chennai, the number of Economics students from Chennai decreases. For example, if 50 students from other majors are from Chennai, Economics students from Chennai would be 150 - 50 = 100, which is (100 / 150) × 100 = 66.67%, lower than 73.33%. Thus, 110 is indeed the maximum.
Final Answer
The largest possible percentage of Economics students from Chennai, rounded to the nearest integer, is 73%.
|
77 videos|180 docs|96 tests
|
FAQs on 12 Minute Test: Pie Charts - Logical Reasoning (LR) and Data Interpretation (DI) - CAT
| 1. What is the duration of the Tables CAT exam? |  |
| 2. How can I prepare for the Tables CAT exam? | |
| 3. Can I use a calculator during the Tables CAT exam? | |
| 4. Are there any specific strategies or tips to excel in the Tables CAT exam? | |
| 5. How are the scores calculated in the Tables CAT exam? | |


Important questions
,12 Minute Test: Pie Charts | Logical Reasoning (LR) and Data Interpretation (DI) - CAT
,ppt
,Exam
,shortcuts and tricks
,past year papers
,MCQs
,study material
,Semester Notes
,mock tests for examination
,Free
,practice quizzes
,video lectures
,12 Minute Test: Pie Charts | Logical Reasoning (LR) and Data Interpretation (DI) - CAT
,Viva Questions
,Extra Questions
,Objective type Questions
,12 Minute Test: Pie Charts | Logical Reasoning (LR) and Data Interpretation (DI) - CAT
,Summary
,Sample Paper
,Previous Year Questions with Solutions
;


12 Minute Test: Pie Charts Free PDF Download
Importance of 12 Minute Test: Pie Charts
12 Minute Test: Pie Charts Notes
12 Minute Test: Pie Charts CAT Questions
Study 12 Minute Test: Pie Charts on the App
|
© EduRev
|
Education Revolution
|


|


