12 Minute Test: Line Graphs and X-Y Charts | Logical Reasoning (LR) and Data Interpretation (DI) - CAT PDF Download

The CAT exam demands quick thinking and efficient time management, especially in the Data Interpretation and Logical Reasoning (DILR) section, where interpreting charts like Line Graphs and X-Y Charts under time pressure is crucial. By practising with this focused test, you’ll sharpen your ability to interpret and analyse data from these charts, building the skills needed to tackle similar questions on the actual exam and boosting your confidence and performance.
Evaluating Performance
This test contains two sets of Line Graph and X-Y Chart questions, each of which you should aim to solve in 12 minutes.
If you solve within 12 minutes: You’re meeting the baseline for a top percentile. Now aim for 10-11 minutes per set to breach the 100-percentile barrier (solving 3+ sets in 40 minutes).
If you exceed 12 minutes: Focus on identifying gaps, such as misinterpreting data trends, confusing axes, or slow calculations.
Only after thorough self-effort should you review solutions to pinpoint what you missed, ensuring maximum learning and preparation for the CAT’s demanding DILR section. Good luck!
Set 1
The following graphs give the revenues and growth rates of 4 divisions of Garbage Inc, an interesting company that specialises in waste management: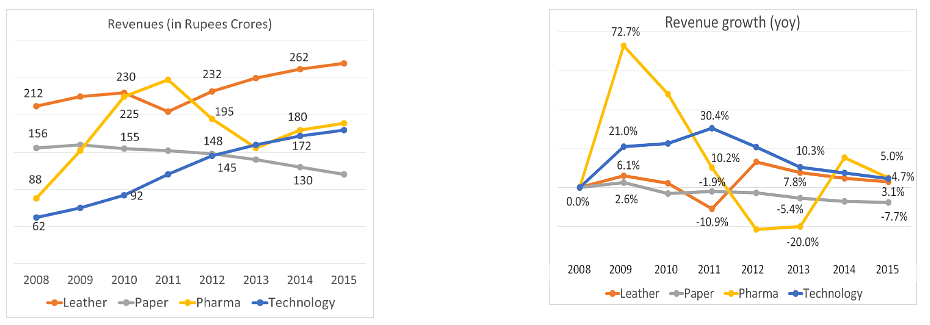
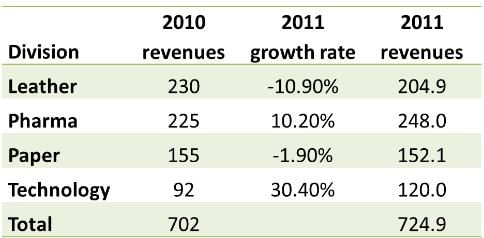
Q1: What was the total revenues in 2011?
(a) Rs. 640 Crores
(b) Rs. 725 Crores
(c) Rs. 760 Crores
(d) Rs. 680 Crores
Ans: b
Sol: We know 2010 revenues by division and 2011 growth rates by division. We just need to put these two together.
2011 revenues were Rs. 725 Crores.
Choice B is the correct answer.
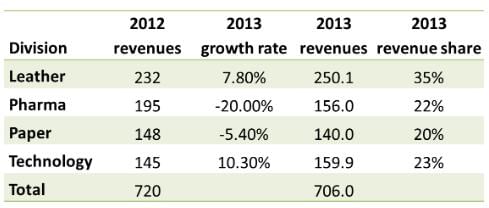
Q2: In the year 2013, what was the share of revenues of the division Pharma?
(a) 27%
(b) 35%
(c) 19%
(d) 22%
Ans: d
Sol: Once again, we can compute 2013 numbers using actuial 2012 numbers and 2013 growth rates by division.
Share of Pharma is 22%.
Q3: Which year saw the highest percentage growth in revenues overall?
(a) 2009
(b) 2010
(c) 2011
(d) 2012
Ans: a
Step 1: Check the “Revenue growth (yoy)” graph (right-hand side)2009: Pharma = 72.7% (very high), Tech = 21.0%, Leather = 6.1%, Paper = 2.6%.
2010: Pharma = 30.4%, Tech = 20.3%, Leather = 0.2%, Paper = –10.9%.
2011: Tech = 16.1%, Pharma = 10.2%, Leather = –1.9%, Paper = 7.8%.
2012: Tech = 10.3%, Pharma = –5.4%, Leather = –7.7%, Paper = –3.1%.
Step 2: Spot the maximum
Clearly, Pharma in 2009 = 72.7% is the highest among all.
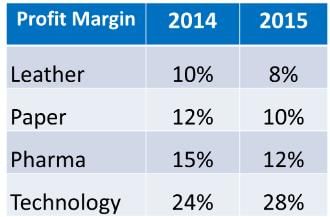
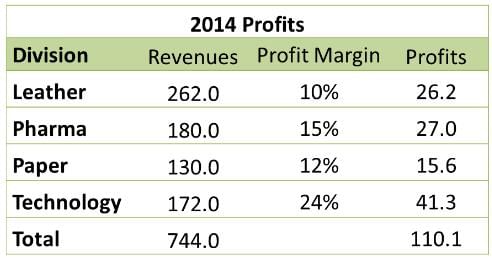
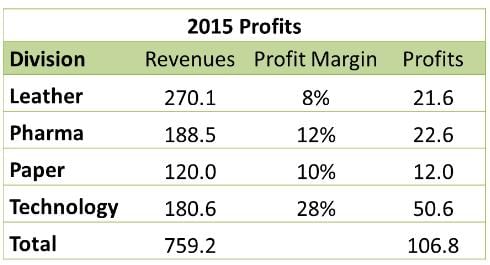
Q4: The profit margins by division in the years 2014 and 2015 are given in the table below. Find the yoy percentage growth in profits in 2015.
(a) -3%
(b) -6%
(c) 2.4%
(d) 0%
Ans: a
Sol: 2014 and 2015 profits by division are as follows
Profits have gone from Rs. 110.1 Crores in 2014 to Rs. 106.8 Crores in 2015, a decline of 3%.
Hence, the answer is "-3%".
Set 2
Direction: Refer to the following chart and solve the questions based on it.
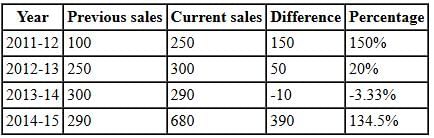
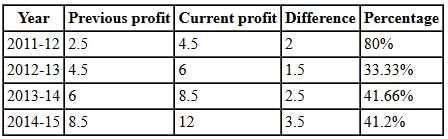
The figure below represents the sales and net profit (in Rs. crore) of IVP Ltd. for five years from 2010-11 to 2014-15. During this period, the sales increased from Rs.100 crore to Rs.680 crore. Correspondingly, the net profit increased from Rs. 2.5 crore to Rs. 12 crore. (Net profit is defined as the excess of sales over total costs)
Q1: The highest percentage growth in sales, relative to the previous year occurred in
A: 2011-12
B: 2012-13
C: 2013-14
D: 2014-15
Ans: A
Sol:
the maximum percentage increase relative to previous year occurred in 2011-12.
Q2: The highest percentage growth in net profit, relative to the previous year, was achieved in
A: 2014-15
B: 2013-14
C: 2012-13
D: 2011-12
Ans: B
Sol:
the highest percentage growth in net profit relative to the previous year was achieved in 2013-14.
Q3: Defining profitability as the ratio of net profit to sales, IVP Ltd. recorded the highest profitability in
A: 2014-15
B: 2013-14
C: 2010-11
D: 2012-13
Ans: B
Sol:
the maximum is in profitability 2013-14.
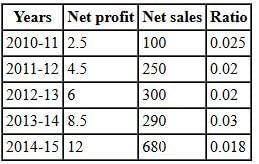
Q: With profitability as defined in question 7, it can be concluded that
A: Profitability is non-decreasing during the five years from 2010-11 to 2014-15
B: Profitability is non-increasing during the five years from 2010-11 to 2014-15
C: Profitability remains constant during the five years from 2010-11 to 2014-15
D: None of the above
Ans: D
Sol:
Profitability doesn't have a set pattern, and the first three lines try to explain it in a general way. So, they don't apply, and answer choice (d) is the right one.
|
77 videos|180 docs|96 tests
|
FAQs on 12 Minute Test: Line Graphs and X-Y Charts - Logical Reasoning (LR) and Data Interpretation (DI) - CAT
| 1. What are line graphs and X-Y charts? |  |
| 2. How can line graphs and X-Y charts be useful in data analysis? | |
| 3. How do you interpret a line graph? | |
| 4. What is the purpose of using an X-Y chart? | |
| 5. Can line graphs and X-Y charts be used to predict future trends? | |


practice quizzes
,Exam
,Summary
,Semester Notes
,MCQs
,past year papers
,12 Minute Test: Line Graphs and X-Y Charts | Logical Reasoning (LR) and Data Interpretation (DI) - CAT
,Viva Questions
,Extra Questions
,Free
,12 Minute Test: Line Graphs and X-Y Charts | Logical Reasoning (LR) and Data Interpretation (DI) - CAT
,ppt
,video lectures
,study material
,mock tests for examination
,12 Minute Test: Line Graphs and X-Y Charts | Logical Reasoning (LR) and Data Interpretation (DI) - CAT
,Previous Year Questions with Solutions
,shortcuts and tricks
,Objective type Questions
,Sample Paper
,Important questions
;


12 Minute Test: Line Graphs and X-Y Charts Free PDF Download
Importance of 12 Minute Test: Line Graphs and X-Y Charts
12 Minute Test: Line Graphs and X-Y Charts Notes
12 Minute Test: Line Graphs and X-Y Charts CAT Questions
Study 12 Minute Test: Line Graphs and X-Y Charts on the App
|
© EduRev
|
Education Revolution
|


|


