Unit 1: Law of Demand and Elasticity of Demand - 2 Chapter Notes | Business Economics for CA Foundation PDF Download
Expansion and Contraction of Demand
The demand schedule, demand curve, and the law of demand indicate that a decrease in the price of a commodity leads to an increase in its quantity demanded, assuming other factors remain constant. When a price drop results in an increased quantity demanded, it is referred to as an expansion of demand. Conversely, when a price increase leads to a decrease in quantity demanded, it is termed a contraction of demand. For instance, if the price of apples is ₹100 per kilogram and a consumer purchases one kilogram at that price, and then the price drops to ₹80 per kilogram while all other factors like income and consumer preferences remain unchanged, and the consumer buys two kilograms, this situation reflects a change in quantity demanded or an expansion of demand. On the other hand, if the price of apples rises to ₹150 per kilogram and the consumer only buys half a kilogram, this represents a contraction of demand. The concepts of expansion and contraction of demand are illustrated in Figure 3. The figure demonstrates that at price OP, the quantity demanded is OM, given other conditions are equal. When the price increases to OP II, the quantity demanded decreases to OL, indicating a 'fall in quantity demanded', 'contraction of demand', or 'an upward movement along the same demand curve'. Similarly, when the price decreases to OP I, the quantity demanded increases to ON, signifying an 'expansion of demand', 'a rise in quantity demanded', or 'a downward movement on the same demand curve.' 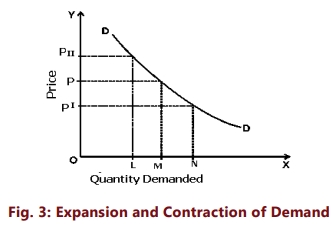
Increase and Decrease in Demand
Up to this point, we have assumed that when analyzing the demand for a commodity, the other determinants of demand remain unchanged. It is important to note that demand expansion and contraction occur due to price changes, while all other demand determinants—such as income, preferences, consumption habits, and prices of related goods—stay constant. The phrase "other factors remaining constant" indicates that the demand curve's position remains unchanged, with consumers moving either downward or upward along it. There are non-price factors or demand conditions that can lead to an increase or decrease in the quantity of a specific good or service that consumers are willing to demand at a particular price. What occurs when there is a shift in consumer preferences, income levels, the prices of related goods, or other influencing factors on demand? For instance, let’s examine the impact of an increase in consumer income on the demand for commodity X: Table 3 illustrates the potential effects of an increase in consumer income on the quantity demanded of commodity X.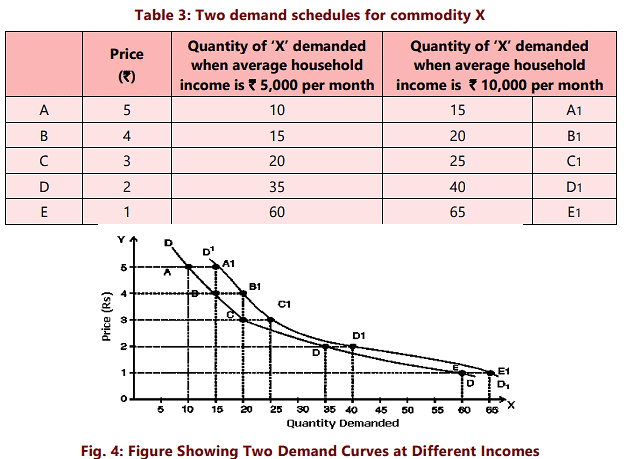
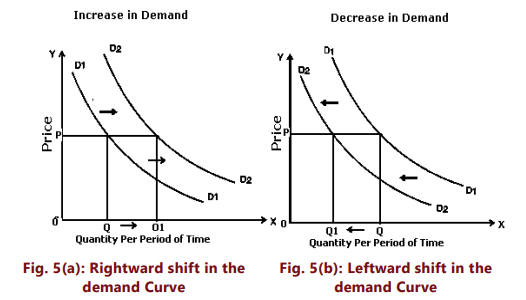
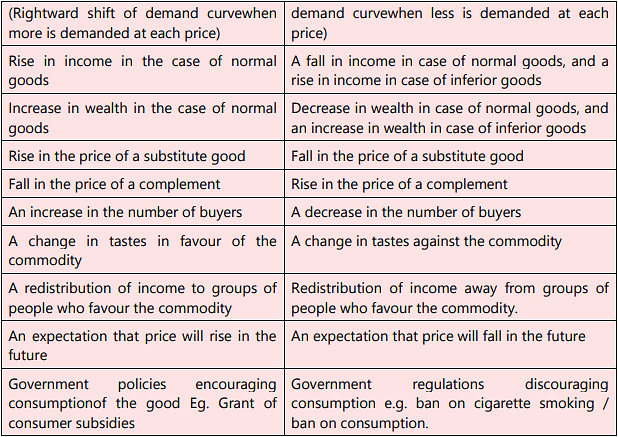
The two data sets are represented in Figure 4 as DD for demand at an average household income of ₹ 5000, and D'D' for an income of ₹ 10,000. The increase in income has caused the demand curve for X to shift to the right. This shift from DD to D'D' reflects a heightened willingness to purchase 'X' at every price level. For instance, at a unit price of ₹ 4, the quantity demanded is 15 units when the household income averages ₹ 5,000. However, when the income increases to ₹ 10,000, the demand rises to 20 units at the same price. A similar rise in demand can be observed at all price points. This increase occurs independently of the market price, resulting in a rightward shift of the entire demand curve. Conversely, we can consider the price consumers would be prepared to pay for a specific quantity, such as 15 units of X. With a higher income, they might be willing to pay ₹ 5 instead of ₹ 4. Thus, an increase in income shifts the demand curve to the right, while a decrease in income leads to a leftward shift. Any change that increases the quantity demanded at all prices results in a rightward shift of the demand curve, termed an increase in demand. Conversely, a change that reduces the quantity demanded at every price leads to a leftward shift, known as a decrease in demand. Figures 5(a) and (b) depict the increase and decrease in demand, respectively. An increase in demand causes the demand curve to shift right, resulting in a higher quantity purchased at a given price (Q1 instead of Q at price P). A decrease in demand shifts the entire curve left, leading to a reduced quantity bought at the same price P.
The table below summarises the effect of non - price determinants on demand
Movements along the Demand Curve vs. Shift of Demand Curve
It is crucial for business decision-makers to grasp the difference between a movement along a demand curve and a shift of the entire demand curve.
A movement along the demand curve signifies changes in the quantity demanded due to price changes, assuming all other factors remain constant. Conversely, a shift of the demand curve indicates that demand changes at every price level because one or more external factors—such as income, consumer preferences, or the prices of related goods—have altered.
When economists refer to an increase or decrease in demand, they are indicating a shift of the entire curve, as one or more previously constant factors have changed. In contrast, when they mention a change in quantity demanded, they are referring to a movement along the same curve (i.e., expansion or contraction of demand) caused by price fluctuations of the commodity.
In summary, 'change in demand' refers to a shift of the demand curve to the right or left due to variations in factors like income, preferences, and prices of other goods. In contrast, 'change in quantity demanded' refers to movement upwards or downwards on the same demand curve due to price changes of the commodity. When demand rises due to factors other than price, firms can sell more at existing prices, resulting in increased revenue. The goal of advertisements and other sales promotion activities is to shift the demand curve to the right and reduce demand elasticity. However, acquiring this additional demand incurs costs as firms need to spend on advertising and promotional strategies.
Elasticity of Demand
Until now, we have focused on the direction of changes in prices and quantities demanded. From a business firm's perspective, it is crucial to understand the extent of the relationship or the degree of responsiveness of demand to its determinants. Typically, we want to determine how sensitive the demand for a product is to its price; for instance, if the price increases by 5 percent, how much will the quantities demanded change? Additionally, how will a 5 percent rise in average income affect demand? What impact will an advertising campaign have on sales? Economists utilize various types of elasticity to address these questions for demand predictions and strategy recommendations.
Consider the following scenarios:
- When the price of headphones decreased from ₹ 500 to ₹ 400, the quantity demanded rose from 100 headphones to 150 headphones.
- When the price of wheat fell from ₹ 20 per kilogram to ₹ 18 per kilogram, the quantity demanded increased from 500 kilograms to 520 kilograms.
- When the price of salt dropped from ₹ 9 per kilogram to ₹ 7.50, the quantity demanded grew from 1000 kilograms to 1005 kilograms.
What is noticeable? The demand for headphones, wheat, and salt reacts in the same direction to price changes. However, the degree of response varies. The differences in demand responsiveness can be evaluated by comparing the percentage changes in prices and quantities demanded. This is where the concept of elasticity comes into play.
The quantity of a commodity purchased depends on various factors, such as the price of the commodity, prices of related goods, consumer income, and other demand determinants. A change in any of these independent variables will lead to a change in the dependent variable, which is the amount purchased per unit of time. The elasticity of demand quantifies the relative responsiveness of the amount purchased per unit of time to changes in any of these independent variables while holding others constant. Generally, the elasticity coefficient is defined as the proportionate change in the dependent variable divided by the proportionate change in the independent variable. Elasticity of demand measures the degree of responsiveness of the quantity demanded of a good to changes in one of the variables affecting demand. More specifically, it is the percentage change in quantity demanded divided by the percentage change in one of the relevant variables.
Different measures of elasticity can be identified, including price elasticity, cross elasticity, income elasticity, advertisement elasticity, and elasticity of substitution. It is important to note that when referring to elasticity of demand, unless specified otherwise, we are referring to price elasticity of demand. In other words, price elasticity of demand is commonly understood as elasticity of demand.
Price Elasticity of Demand
Perhaps, the most important measure of elasticity of demand is the price elasticity of demand which measures the sensitivity of quantity demanded to ‘own price’ or the price of the good itself. The concept of price elasticity of demand is important for a firm for two reasons.
- Knowledge of the nature and degree of price elasticity allows firms to predict the impact of price changes on its sales.
- Price elasticity guides the firm’s profit-maximizing pricing decisions.
Price elasticity of demand expresses the degree of responsiveness of quantity demanded of a good to a change in its price, given the consumer’s income, his tastes and prices of all other goods. In other words, it is measured as the percentage change in quantity demanded divided by the percentage change in price, other things remaining equal. The price elasticity of demand (also referred to as PED) tells us the percentage change in quantity demanded for each one percent (1%) change in price. That is,
The percentage change in a variable is just the absolute change in the variable divided by the original level of the variable.
Therefore,

In symbolic terms
Ep represents price elasticity, q denotes original quantity, p signifies original price, and ∆ indicates a change. A negative sign in the elasticity of demand reflects the law of demand: as price increases, the quantity demanded decreases. This change in quantity is attributed solely to the price change, with no alterations in other factors that could influence sales, such as income or competitors' prices. The larger the elasticity value, the more sensitive the quantity demanded is to price fluctuations. Technically, price elasticity values range from negative infinity to approaching zero, due to the negative sign in Δq/Δp. This indicates that price and quantity are inversely related (with some exceptions), making price elasticity negative. When interpreting the price elasticity coefficient, we focus on its magnitude—ignoring the negative sign. For instance, if Ep = -1.22, we consider the elasticity to be 1.22 in magnitude. Thus, a 1% price change resulting in a 2% change in quantity demanded for good A and a 4% change for good B yields elasticities of 2 and 4, respectively, indicating that demand for B is more responsive to price changes than that for A. If we included the negative signs, we would mistakenly conclude that demand for A is more elastic than for B, which is incorrect. Therefore, by convention, we consider the absolute value of price elasticity for drawing conclusions.
A numerical example for price elasticity of demand:
Illustration 1: The price of a commodity decreases from ₹ 6 to ₹ 4 and quantity demanded of the good increases from 10 units to 15 units. Find the coefficient of price elasticity.
Sol: Price elasticity = (-) Δ q / Δ p × p/q = 5/2 × 6/10 = (-) 1.5
Illustration 2: A 5% fall in the price of a good leads to a 15% rise in its demand. Determine the elasticity and comment on its value.
Sol:
= 15% / 5% = 3
Illustration 3: The price of a good decreases from ₹ 100 to ₹ 60 per unit. If the price elasticity of demand for it is 1.5 and the original quantity demanded is 30 units, calculate the new quantity demanded.
Sol:
Here
Therefore new quantity demanded = 30+18 = 48 units
Illustration 4: The quantity demanded by a consumer at price ₹ 9 per unit is 800 units. Its price falls by 25% and quantity demanded rises by 160 units. Calculate its price elasticity of demand.
Sol: Change in quantity demanded = 160
Therefore, % change in quantity demanded = 20%
% change in price = 25%
Illustration 5: A consumer buys 80 units of a good at a price of ₹ 4 per unit. Suppose price elasticity of demand is - 4. At what price will he buy 60 units?
So:
or
or
x = 4.2 per unit
Point Elasticity
The point elasticity of demand refers to the price elasticity of demand at a specific point along the demand curve. This concept is utilized to quantify price elasticity when the price change is infinitesimally small. Price elasticity plays a crucial role in applying marginal analysis to identify optimal pricing. Since marginal analysis assesses “small” changes related to an initial decision, measuring elasticity in terms of an infinitesimally minor price change is advantageous. Point elasticity employs derivatives instead of finite changes in price and quantity. It can be defined as:
Where dq/dp is the derivative of quantity with respect to price at a point on the demand curve and p and q are the price and quantity at that point. Economists generally use the word “elasticity” to refer to point elasticity.
Point elasticity is, therefore, the product of price quantity ratio at a particular point on the demand curve and the reciprocal of the slope of the demand line.
Measurement of Elasticity on a Linear Demand Curve – Geometric Method
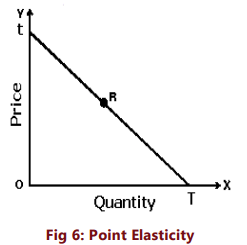
By definition, the price elasticity of demand is calculated as the change in quantity related to a change in price (∆Q/∆P) multiplied by the ratio of price to quantity (P/Q). Consequently, the price elasticity of demand is influenced not only by the slope of the demand curve but also by the price and quantity. Therefore, elasticity varies along the curve as price and quantity change. Although the slope of a linear demand curve remains constant, elasticity at different points on this curve differs. When the price is high and quantity is low, elasticity is high. As we move down the curve, elasticity decreases.
Given a straight line demand curve tT, (Fig.6 above) point elasticity at any point say R can be found by using the formula
Using the above formula we can get elasticity at various points on the demand curve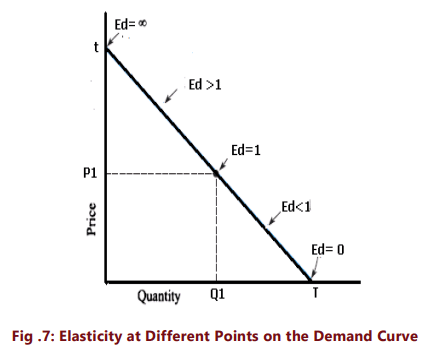
Thus, we see that as we move from T towards t, elasticity goes on increasing. At the midpoint it is equal to one, at point t, it is infinity and at T it is zero.
Arc-Elasticity
Price elasticity can often be calculated over a segment of the demand curve instead of at a specific point. This is relevant when price and quantity changes are significant and discrete, necessitating the measurement of elasticity over an arc of the demand curve.When determining price elasticity between two prices (or two points on the demand curve, referred to as A and B in figure 8), there is a question of which price and quantity to use as the base. Using the original price and quantity figures as a base will yield different elasticity values compared to using the new price and quantity figures. To prevent confusion, the mid-point method is preferred, where the averages of the two prices and quantities are taken as the base (i.e., original and new). The midpoint formula serves as an approximation for the actual percentage change in a variable, but it offers the benefit of consistent elasticity values regardless of the direction of the price change.
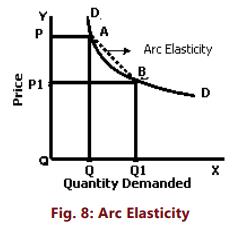
The arc elasticity can be found out by using the formula: We drop the minus sign and use the absolute value.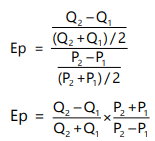
Where P1, Q1 are the original price and quantity and P2, Q2 are the new ones. Thus, if we have to find elasticity of demand for headphones between:
P1 = ₹ 500 Q1= 100
P2 = ₹ 400 Q2 = 150
We will use the formula
Or

or
Ep =1.8
The arc elasticity will always lie somewhere (but not necessarily in the middle) between the point elasticities calculated at the lower and the higher prices.
Interpretation of the Numerical Values of Elasticity of Demand
Economists categorize demand behavior based on price elasticity values. Demand curves are plotted with price on the vertical axis and quantity on the horizontal axis, resulting in ∆Q/∆P = (1/slope of curve). Thus, a steeper slope indicates less elastic demand.
The elasticity of demand can range from zero to infinity:
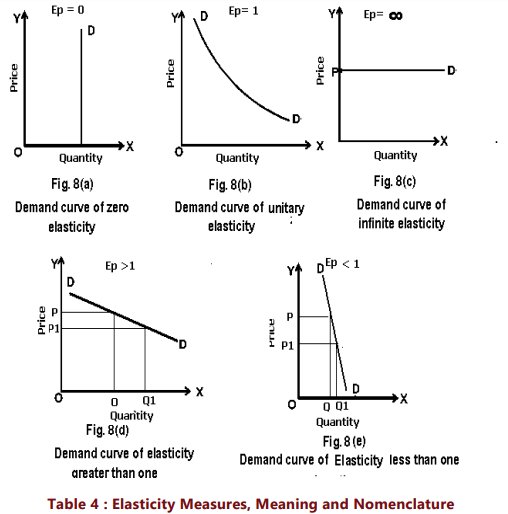
- Elasticity is zero (Ep = 0): This occurs when quantity demanded does not change with price alterations; consumers buy a fixed quantity regardless of price fluctuations. Perfectly inelastic demand is a theoretical extreme, represented by a vertical demand curve.
- Elasticity is one (Ep = 1): This situation arises when the percentage change in quantity demanded equals the percentage change in price. This is known as unitary elasticity, illustrated by a rectangular hyperbola.
- Elasticity is greater than one (Ep > 1): Here, the percentage change in quantity demanded exceeds the percentage change in price, indicating elastic demand. The demand curve in this case is relatively flat.
- Elasticity is less than one (Ep < 1): In this case, the percentage change in quantity demanded is less than the percentage change in price, indicating inelastic demand. The demand curve is steep in this scenario.
- Elasticity is infinite (Ep = ∞): A small price reduction can increase demand from zero to infinity. The demand curve is horizontal at this price level, meaning any price change leads to a quantity demanded change, with even a slight price increase resulting in zero demand. This situation is typical in a perfectly competitive market.

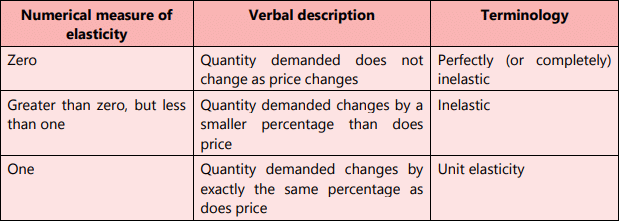

Now that we are able to classify goods according to their price elasticity, let us see whether the goods mentioned below are price elastic or inelastic.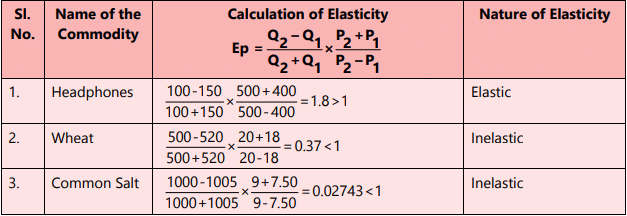
In the hypothetical example, we observe that the demand for headphones is highly elastic, whereas the demand for wheat is relatively inelastic, and the demand for salt remains consistent even with a price drop.
The price elasticity of demand for most goods typically falls between the extremes of zero and infinity. In practical scenarios, we find that the demand for items like refrigerators, TVs, laptops, and fans tends to be elastic; the demand for staples such as wheat and rice is inelastic; and the demand for salt is either highly inelastic or perfectly inelastic. This variation in consumer behavior regarding different commodities is noteworthy. We will later elaborate on the factors contributing to the differences in elasticity of demand among various goods. Prior to that, we will examine another method of calculating price elasticity known as the total outlay method.
Total Outlay Method of Calculating Price Elasticity
The price elasticity of demand for a commodity is significantly related to the total expenditure or outlay made on it. Since total expenditure (price multiplied by quantity purchased) represents the total revenue received by the seller (price multiplied by quantity sold), we can conclude that price elasticity and total revenue are closely linked. By analyzing changes in total expenditure (or total revenue) in response to a price change, we can determine the price elasticity of demand for the commodity.
Price Elasticity of Demand Equals One (Unity): When a change in the price of a good results in the total expenditure or total revenue remaining unchanged, the price elasticity for that good is equal to unity. This occurs because total expenditure can only remain constant if the proportional change in quantity demanded equals the proportional change in price. Therefore, if there is a specific percentage increase (or decrease) in price and the price elasticity is unitary, the total expenditure by the buyer or total revenue received remains unchanged.
Price Elasticity of Demand Greater Than Unity: When an increase in the price of a good leads to a decrease in total expenditure or total revenue, or when a price decrease results in an increase in total expenditure or total revenue, the price elasticity of demand is greater than unity. For example, in the case of headphones, a price drop from ₹500 to ₹400 increases total revenue from ₹50,000 (500x100) to ₹60,000 (400x150), indicating elastic demand. Conversely, if the price of headphones rises from ₹400 to ₹500, demand would drop from 150 to 100, causing total revenue to fall from ₹60,000 to ₹50,000, further demonstrating elastic demand.
Price Elasticity of Demand Less Than Unity: When an increase in the price of a good results in an increase in total expenditure or total revenue, or a price decrease leads to a decrease in total expenditure or total revenue, the price elasticity of demand is less than unity. For instance, in the example of wheat, a price drop from ₹20 per kg to ₹18 per kg causes total revenue to decrease from ₹10,000 (20 x 500) to ₹9,360 (18 x 520), indicating inelastic demand. Similarly, an increase in the price of wheat from ₹18 to ₹20 per kg raises total revenue from ₹9,360 to ₹10,000, again indicating inelastic demand. The limitation of this method is that it can only classify demand as elastic or inelastic; it does not provide the exact coefficient of price elasticity.
Importance of Elasticity of Demand to Business Firms
A business firm should be concerned about the elasticity of demand because it predicts how price changes will affect the total revenue generated from the sale of that good. Total revenue is defined as the total value of sales of a good or service, calculated as price multiplied by quantity sold.
Total Revenue
Total revenue (TR) = Price × Quantity sold
Except in the rare case of a good with perfectly elastic or perfectly inelastic demand, when a seller raises the price of a good, there are two effects which act in opposite directions on revenue.
- Price effect: After a price increase (decrease), each unit sold sells at a higher (lower) price, which tends to raise (lower) the revenue.
- Quantity effect: After a price increase (decrease), fewer (more) units are sold, which tends to lower (increase) the revenue.
What will be the net effect on total revenue? It depends on which effect is stronger. If the price effect which tends to raise total revenue is the stronger of the two effects, then total revenue goes up. If the quantity effect, which tends to reduce total revenue, is the stronger, then total revenue goes down.
The price elasticity of demand tells us what happens to the total revenue when price changes: its size determines which effect, the price effect or the quantity effect, is stronger.
If demand for a good is unit-elastic (the price elasticity of demand is equal to one; Figure 9), an increase in price or decrease in price does not change total revenue. In this case, the quantity effect and the price effect exactly balance each other. When price rises from P to P1, the gain in revenue (Area A) is equal to loss in revenue due to lost sales (Area B)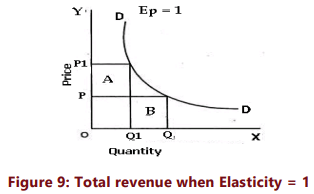
If demand for a good is inelastic (the price elasticity of demand is less than one), a higher price increases total revenue. In this case, the quantity effect is weaker than the price effect.
On the contrary, when demand is inelastic, a fall in price reduces total revenue because the quantity effect is dominated by the price effect. Refer Figure 8 (e) above.
If demand for a good is elastic (the price elasticity of demand is greater than one), an increase in price reduces total revenue and a fall in price increases total revenue. In this case, the quantity effect is stronger than the price effect. Refer Figure 8 (d) above.
Table 5 below summarizes the relationship between price elasticity and total revenue
Determinants of Price Elasticity of Demand
Price Elasticity of Demand: Key Determinants
In the previous section, we discussed price elasticity and its measurement. An essential question arises: What factors determine whether the demand for a good is elastic or inelastic? Below are the significant determinants of price elasticity:
- Availability of Substitutes: The degree of substitutability and the availability of substitutes is a crucial determinant of elasticity. Goods like butter, cabbage, cars, and soft drinks have close substitutes (margarine, other vegetables, different car brands, and other soft drinks respectively). A price change in these goods, while keeping substitute prices constant, will likely result in substantial substitution. Conversely, commodities such as salt and housing have few satisfactory substitutes, leading to smaller changes in quantity demanded when prices rise. Generally, goods with close or perfect substitutes exhibit highly elastic demand; the wider the range of substitutes, the greater the elasticity.
- Position in Consumer’s Budget: A greater proportion of income spent on a commodity typically results in higher elasticity of demand. Goods like salt and buttons have inelastic demand as they constitute a small fraction of income, while rentals and clothing, which absorb a more significant share of income, tend to have elastic demand.
- Nature of Need: Luxury goods are usually price elastic as they are non-essential, while necessities are price inelastic. For instance, the demand for a home theatre is relatively elastic, whereas demand for basic food and housing is generally inelastic. Goods that can be postponed in consumption tend to have elastic demand, while necessary goods do not.
- Number of Uses: Commodities with multiple uses exhibit greater price elasticity. For example, if the price of milk decreases, its consumption may extend to various uses like making curd or sweets. If the price increases, its use may be limited to essential purposes.
- Time Period: The longer the time period available, the more adjustments consumers can make. For example, in response to higher petrol prices, consumers may initially reduce trips, but over time, they may change to smaller cars or alter habits significantly, leading to a more elastic demand.
- Consumer Habits: Habitual consumption leads to inelastic demand, as rigid preferences mean demand remains steady despite price changes.
- Tied Demand: Goods that are tied to others typically exhibit inelastic demand, unlike those with autonomous demand. For instance, printers and ink cartridges demonstrate this relationship.
- Price Range: Goods at either high or low price ranges tend to have inelastic demand, while those in the middle price range are more elastic.
- Minor Complementary Items: Cheap complementary items associated with more expensive products tend to have inelastic demand.
Understanding price elasticity and its influencing factors is crucial for business managers, as it aids in recognizing the impact of price changes on total sales and revenues. Firms strive to maximize profits, and knowledge of price elasticity informs optimal pricing strategies.
If demand for a product is elastic, managers should lower prices to increase sales volume and total revenue. Conversely, if demand is elastic, price increases should be approached cautiously, as they could lead to a significant decline in total revenue due to reduced sales. If demand is inelastic, firms may increase prices confidently, knowing that the decrease in sales will be less than proportionate.
Furthermore, understanding price elasticity is vital for governments in setting prices for goods and services, such as transport and telecommunications. It helps them gauge the responsiveness of demand to price increases due to taxation and the resulting implications on tax revenues. This understanding explains why governments prefer to raise indirect taxes on goods with relatively inelastic demand, such as alcohol and tobacco.
Income Elasticity of Demand
The income elasticity of demand is a measure of how much the demand for a good is affected by changes in consumers’ incomes. Estimates of income elasticity of demand are useful for businesses to predict the possible growth in sales as the average incomes of consumers grow over time. Income elasticity of demand is the degree of responsiveness of the quantity demanded of a good to changes in the income of consumers. In symbolic form,
This can be given mathematically as follows: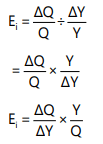
Ei = Income elasticity of demand
∆Q = Change in demand
Q = Original demand
Y = Original money income
∆Y = Change in money income
There is a useful relationship between income elasticity for a good and the proportion of income spent on it. The relationship between the two is described in the following three propositions:
- If the proportion of income spent on a good remains the same as income increases, then income elasticity for that good is equal to one.
- If the proportion of income spent on a good increase as income increases, then the income elasticity for that good is greater than one. The demand for such goods increase faster than the rate of increase in income.
- If the proportion of income spent on a good decrease as income rises, then income elasticity for the good is positive but less than one. The demand for income-inelastic goods rises, but substantially slowly compared to the rate of increase in income. Necessities such as food and medicines tend to be income- inelastic
The above stated propositions can be better understood with the help of the below example: Let, the price of a commodity is ₹ 10 per unit. Initially the consumer’s income is ₹ 100 and he spends @10% of his income i.e. ₹ 10 on the commodity demanding 1 unit of the same. Now, as the consumer’s income doubled to ₹200 (or increased by 100%), there may be three possibilities causing different degrees of income elasticity of demand as follows: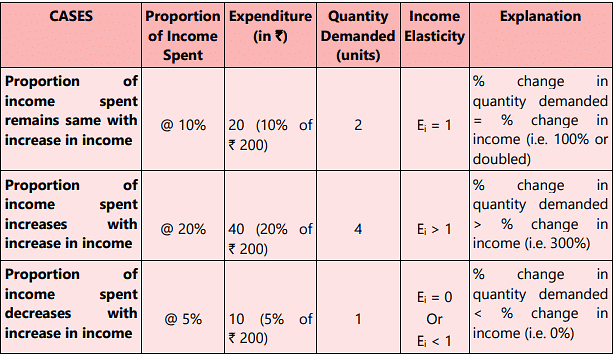
The income elasticity of goods indicates several key characteristics of demand for those goods. If the income elasticity is zero, it means that demand for the good is largely unaffected by changes in income. When income elasticity is greater than zero (positive), an increase in income results in increased demand for the good, typical of most goods known as normal goods, which all have positive income elasticity. However, the extent of elasticity varies depending on the type of commodity.
When the income elasticity of demand is negative, the good is classified as an inferior good; in this case, the quantity demanded at a given price falls as income rises, as consumers tend to opt for better substitutes when their income increases. Another important value of income elasticity is one. When income elasticity of demand equals one, the proportion of income spent on the goods remains constant as consumer income increases, serving as a useful benchmark. If the income elasticity for a good exceeds one, it indicates that the good occupies a larger portion of consumer expenditure as they become wealthier, categorizing such goods as luxury goods. Conversely, if the income elasticity is less than one, it suggests that the good is either less significant to consumers or is a necessity.
The following examples will make the above concepts clear:
(a) The income of a household rises by 10%, the demand for wheat rises by 5%.
(b) The income of a household rises by 10%, the demand for T.V. rises by 20%.
(c) The incomes of a household rises by 5%, the demand for bajra falls by 2%.
(d) The income of a household rises by 7%, the demand for commodity X rises by 7%.
(e) The income of a household rises by 5%, the demand for buttons does not change at all.
Using formula for income elasticity
We will find income-elasticity for various goods. The results are as follows: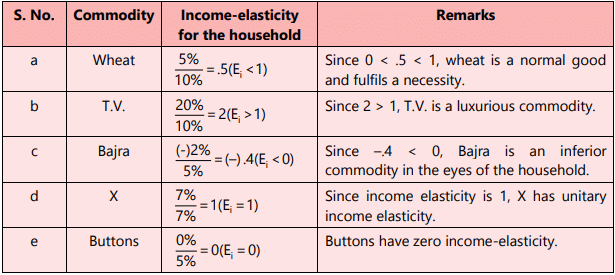
It is important to note that the terms ‘luxury’, ‘necessity’, and ‘inferior good’ do not reflect their strict dictionary definitions in this context. In economic theory, we differentiate them as described above. A key aspect of income elasticity is that it varies between the short run and long run. For most goods and services, the income elasticity of demand is greater in the long run compared to the short run. Understanding income elasticity of demand is beneficial for businesses as it aids in forecasting future demand for their products. This knowledge allows firms to assess how sensitive their sales are to changes in consumer incomes and to anticipate the effects of economic cycles on market demand. For example, if EY = 1, sales change in direct proportion to income variations. If EY > 1, sales are very sensitive to income fluctuations, indicating high cyclicality. Conversely, for inferior goods, sales are countercyclical, meaning they move inversely to income changes, resulting in EY < 0. This understanding helps firms with effective production planning and management.
Illustration 6
Income Elasticity of Demand
A car dealer sells new as well as used cars. Sales during the previous year were as follows: During the previous year, other things remaining the same, the real incomes of the customers rose on average by 10%. During the last year sales of new cars increased to 500, but sales of used cars declined to 3,850.
What is the income elasticity of demand for the new as well as used cars? What inference do you draw from these measures of income elasticity?
Sol:
Income Elasticity of demand for new cars
Percentage change in income = 10%, given
Percentage change in quantity of new cars demanded = (∆ Q/Q) X 100 = (100/400) X100 = 25%
Income elasticity of demand = 25%/ 10% = + 2.5
New car is therefore income elastic. Since income elasticity is positive, new car is a normal good.
Income Elasticity of demand for used cars
Percentage change in income = 10%, given
% change in quantity of used cars demanded = (∆ Q/Q) X 100 = (-1 50/4000) x100 = - 3.75%- Income elasticity of demand = – 3.75/10= –.375
Since income elasticity is negative, used car is an inferior good.
|
124 videos|190 docs|88 tests
|
|
124 videos|190 docs|88 tests
|

|
Explore Courses for CA Foundation exam
|

|
