Olympiad Notes: Logical Venn Diagrams | Science Olympiad Class 6 PDF Download
| Table of contents |
|
| Introduction |
|
| Components of Logical Venn Diagrams |
|
| Types of Relationships |
|
| Tips and Tricks for Solving Problems with Logical Venn Diagrams |
|

Introduction
Logical Venn Diagrams are graphical representations used to visualize and analyze relationships between different sets or groups of objects or concepts. They are a powerful tool for solving problems that involve categorization, intersection, and exclusion.
Components of Logical Venn Diagrams
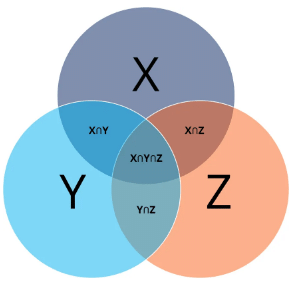
- Circles or Ellipses: In a Logical Venn Diagram, each set or category is represented by a circle or ellipse. These shapes are used to enclose the elements belonging to a particular set.
- Overlapping Regions: When two or more sets have elements in common, the circles or ellipses representing those sets overlap. These overlapping regions indicate the elements shared by the corresponding sets.
- Elements: Elements or objects that belong to a specific set are represented as points within the circle or ellipse corresponding to that set.
Types of Relationships
- Disjoint Sets: If two sets do not share any common elements, the circles representing these sets do not overlap, and there is no overlapping region.
- Intersecting Sets: When sets have some elements in common, the circles overlap, and there is an overlapping region. Elements in this region belong to both sets.
- Subset Relationships: A set can be a subset of another set. In this case, the circle representing the subset is entirely within the circle representing the superset.
Tips and Tricks for Solving Problems with Logical Venn Diagrams
Logical Venn Diagrams are often used to solve problems that involve categorization or counting elements based on given conditions. To solve problems with Venn Diagrams:
- Read the Problem Carefully: Understand the problem statement and the conditions provided.
- Identify the Sets: Determine which sets or categories are involved in the problem. Assign each set to a circle or ellipse.
- Place Elements: Place the elements or objects into the appropriate sets based on the given conditions.
- Analyze the Overlapping Regions: Pay close attention to the overlapping regions, as these indicate elements that belong to multiple sets.
- Answer the Question: Use the information in the diagram to answer the specific question asked in the problem.
Example:
Problem: In a group of students, 40 students like math, 30 students like science, and 20 students like both math and science. How many students like either math or science or both?
Solution:
- Let Set A represent students who like math.
- Let Set B represent students who like science.
- The overlapping region represents students who like both math and science.
- Using the given information, we can construct a Logical Venn Diagram to find the answer.
|
74 videos|147 docs|98 tests
|
FAQs on Olympiad Notes: Logical Venn Diagrams - Science Olympiad Class 6
| 1. What are the components of Logical Venn Diagrams? |  |
| 2. What are the types of relationships depicted in Logical Venn Diagrams? | |
| 3. How can Logical Venn Diagrams help in problem-solving? | |
| 4. What are some tips and tricks for solving problems with Logical Venn Diagrams? | |
| 5. How can Logical Venn Diagrams be used in Olympiad exams? | |


study material
,Olympiad Notes: Logical Venn Diagrams | Science Olympiad Class 6
,Semester Notes
,video lectures
,Extra Questions
,shortcuts and tricks
,past year papers
,Olympiad Notes: Logical Venn Diagrams | Science Olympiad Class 6
,Free
,MCQs
,Olympiad Notes: Logical Venn Diagrams | Science Olympiad Class 6
,practice quizzes
,Exam
,Objective type Questions
,Previous Year Questions with Solutions
,Important questions
,Viva Questions
,Summary
,mock tests for examination
,Sample Paper
,ppt
;


Olympiad Notes: Logical Venn Diagrams Free PDF Download
Importance of Olympiad Notes: Logical Venn Diagrams
Olympiad Notes: Logical Venn Diagrams
Olympiad Notes: Logical Venn Diagrams Class 6 Questions
Study Olympiad Notes: Logical Venn Diagrams on the App
|
© EduRev
|
Education Revolution
|


|


