Chapter Notes: Introduction to Graphs

Introduction
- Graphs are visual tools that help us understand numbers easily. Instead of a table of many numbers, a graph shows patterns, trends and comparisons at a glance.
- Graphs are commonly seen in newspapers, television, magazines and books. They present numerical facts in a visual format, making the information easier and quicker to understand.
- Graphs are visual representations of collected data. Data can also be shown in tables, but graphs are often more effective when we want to show trends, changes over time or differences between groups.
- Graphs provide a clearer and more immediate understanding of data, especially when we need to highlight increases, decreases or comparisons among values.
Let us now study the line graph, a commonly used type of graph for showing change over time.
A Line Graph
When we need to see continuous changes over a period of time, we use a line graph. A line graph plots points for values at different times and joins them with straight line segments to show how the value changes.
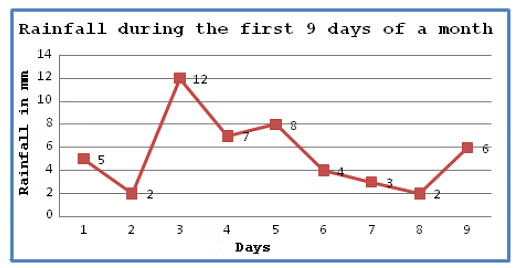
In the figure above, the horizontal line (x-axis) shows the number of days and the vertical line (y-axis) shows the rainfall in mm on each successive day.
From this line graph we can quickly understand how rainfall changed during these nine days of the month: where it increased, decreased or stayed nearly constant.
Do you know?
A line graph that is one unbroken straight line is called a linear graph. A linear graph indicates a constant rate of change.
Coordinates of a Point
To locate any point on a plane, we use two numbers called coordinates. The horizontal axis is called the x-axis and the vertical axis is called the y-axis. Each point is written as an ordered pair of numbers: (x, y).
- x-coordinate tells how many units to move right or left from the origin. It is also called the abscissa.
- y-coordinate tells how many units to move up or down from the origin. It is also called the ordinate.
- While writing the coordinates of a point in the coordinate plane, the x-coordinate comes first, followed by the y-coordinate. We place the coordinates inside brackets, for example (2, 3).
- The coordinates of the point where the x-axis and y-axis meet is (0, 0); this point is called the origin.
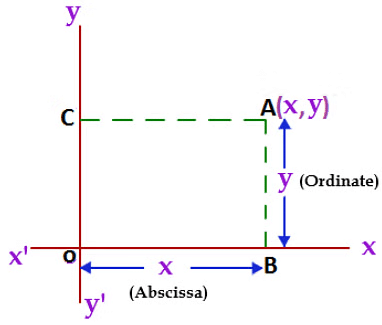
In the figure above, the horizontal distances OB and CA represent the x-coordinate (abscissa), and the vertical distances CO and AB represent the y-coordinate (ordinate). We write the coordinate as (x, y).
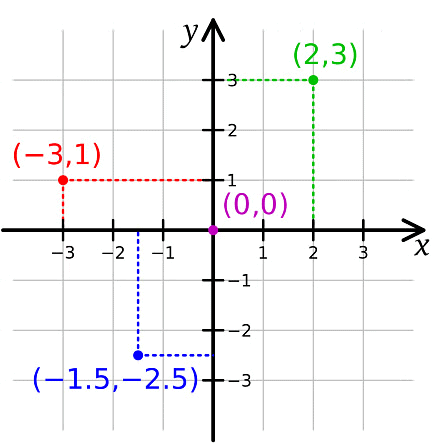
Example: Plot the given points on the graph sheet.
- (2, 3)
- (-3, 1)
- (-1.5, - 2.5)
Solution:
To plot the points, follow these actions in order:
Draw two perpendicular straight lines and mark the intersection point as the origin (0, 0).
Mark equal units on the x-axis to the right for positive x and to the left for negative x; mark equal units on the y-axis upward for positive y and downward for negative y.
Locate the point (2, 3): move 2 units to the right from the origin along the x-axis, then 3 units up; mark the point.
Locate the point (-3, 1): move 3 units to the left along the x-axis, then 1 unit up; mark the point.
Locate the point (-1.5, -2.5): move 1.5 units to the left along the x-axis, then 2.5 units down; mark the point.
Remark: If x ≠ y, then (x, y) ≠ (y, x). If x = y, then (x, y) = (y, x).
Try yourself: Which point has x = -3 and y = 1?
Some Applications
In day-to-day life we use graphs in many situations for comparison and analysis-for example, to compare rainfall in different months, to follow temperature changes through a week, to show company sales across years, or to compare the heights of students in a class.
Independent and Dependent Variables
- Independent Variable: A quantity that can be changed freely and does not depend on another factor. In graphs, the independent variable is usually plotted on the x-axis. Example: time (days, months, years).
- Dependent Variable: A quantity that changes in response to the independent variable. In graphs, the dependent variable is usually plotted on the y-axis. Example: temperature, rainfall, revenue.
The Relationship between the Independent and Dependent Variable
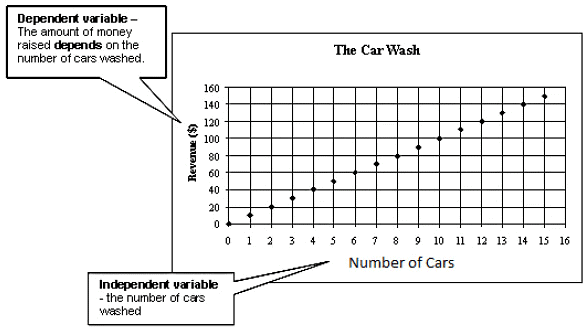
The graph above shows how revenue increases as the number of cars washed increases. Here the number of cars washed is the independent variable and the revenue is the dependent variable. By reading such a graph we can answer questions like: how much revenue will be earned if X cars are washed, or how many cars must be washed to get a target revenue.
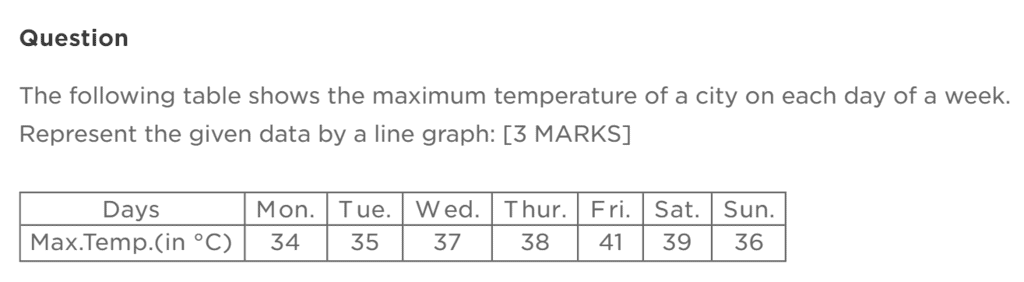
Solution:
Choose the axes and scale for the data.
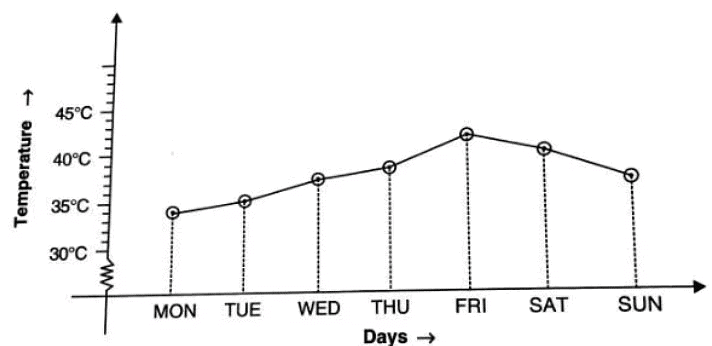
X-axis (horizontal): Days of the week - Monday, Tuesday, Wednesday, Thursday, Friday, Saturday, Sunday.
Y-axis (vertical): Temperature in °C - choose a scale that includes the highest and lowest temperatures recorded; for example, 0°C to 45°C if the highest temperature is 41°C.
Plot the temperature reading for each day as a point with coordinates (day, temperature).
Join the plotted points using straight line segments to make the line graph.
Analyse the graph: identify the highest and lowest temperatures, note any steady increases or decreases, and see on which day the temperature was highest or lowest.
Example 2: The following line graph shows the yearly sales figure for a manufacturing company:
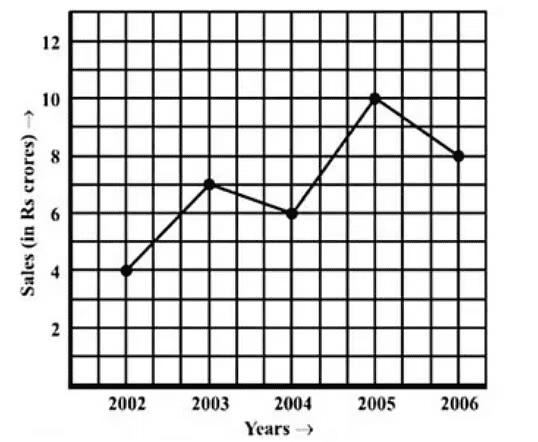
(a) What were the sales in (i) 2002 (ii) 2006?
(b) What were the sales in (i) 2003 (ii) 2005?
(c) Compute the difference between the sales in 2002 and 2006.
(d) In which year was there the greatest difference between the sales as compared to the previous year?
Sol:
(a) (i) Sales in 2002 = Rs. 4 crore.
(ii) Sales in 2006 = Rs. 8 crore.
(b) (i) Sales in 2003 = Rs. 7 crore.
(ii) Sales in 2005 = Rs. 10 crore.
(c) Difference between the sales in 2002 and 2006 = Rs. (8 - 4) crore = Rs. 4 crore.
(d) Compute differences between consecutive years and compare them.
Difference between sales in 2006 and 2005 = Rs. (8 - 10) crore = -Rs. 2 crore (a decrease of Rs. 2 crore).
Difference between sales in 2005 and 2004 = Rs. (10 - 6) crore = Rs. 4 crore.
Difference between sales in 2004 and 2003 = Rs. (6 - 7) crore = -Rs. 1 crore (a decrease of Rs. 1 crore).
Difference between sales in 2003 and 2002 = Rs. (7 - 4) crore = Rs. 3 crore.
Therefore, the greatest rise in sales compared to the previous year occurred between 2004 and 2005 (an increase of Rs. 4 crore).
FAQs on Chapter Notes: Introduction to Graphs
| 1. What is a graph and why is it important in mathematics? |  |
| 2. What are the different types of graphs that students learn in Class 8? | |
| 3. How do you plot a point on a graph? | |
| 4. What are the advantages of using graphs to represent data? | |
| 5. How can you interpret the information presented in a graph? | |


