How to Prepare for GMAT Data Insights | How to prepare for GMAT PDF Download
Scoring well on the Data Insights section is crucial for achieving a strong overall score on the GMAT Focus Exam. Similar to the importance of balanced scores in the Quant and Verbal sections, business schools prefer candidates with a balanced performance in data analysis and interpretation, as these skills are essential for success in the business world. Just as quantitative skills are vital, so too are the ability to comprehend and analyze complex data sets, reflecting the multifaceted demands of business education and professional life.
What are the different parts in the DI section and how are they evaluated?
There are multiple parts to each DI question. To earn points, you must accurately respond to every portion of a question.
EduRev offers topic-wise explanations and tests related to all topics for quick revision.
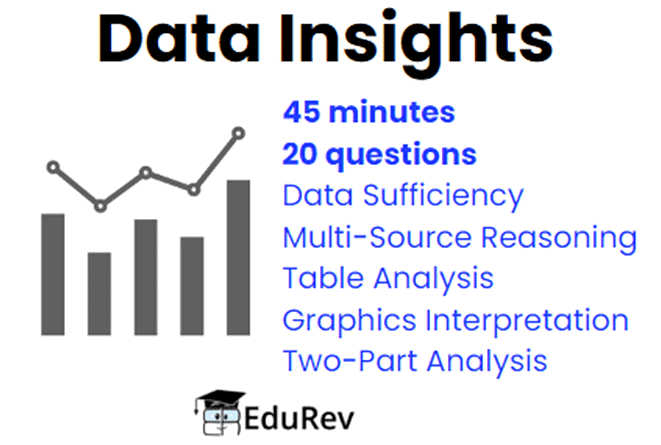
The five GMAT Data Insights questions are:
How to Proceed with Data Insights Questions
Let us look at how to solve all the types of questions that you will face in the DI section of GMAT Focus exam.
1. Data Sufficiency Questions
When tackling Data Sufficiency questions, your main goal is to determine if you have enough information to solve the problem. First, figure out if the problem requires a single precise answer or if a range of values is acceptable. You're just checking if you have the necessary data. Also, don't jump to conclusions based on geometric figures.
How to proceed with questions?
- Clarify Yes/No Questions: Understand that "sometimes yes" or "sometimes no" isn't sufficient. Look for answers that are always true.
- Memorize Answer Choices: Remember the 5 Data Sufficiency answer choices (A, B, C, D, E) and their meanings to streamline decision-making.
- Evaluate Statements Individually: Assess each statement separately before combining them, avoiding premature conclusions.
- Test with Different Numbers: Plug in various types of numbers to test each statement's sufficiency thoroughly.
- Avoid Unnecessary Calculations: Focus on determining sufficiency rather than solving for exact values, saving time and effort.
2. Multi-Source Reasoning Questions
You will see three different tabs of information when answering questions requiring multi-source reasoning. You might see a combination of excerpts, graphs, and charts, or you might see three of the same kind of source. Each source will provide data on a common subject.
How to proceed with questions?
- The GMAT DI section's multi-source reasoning problems are the most time-consuming.
- There are three pages of information and numerous questions on the same subject.
- You might give yourself a little more time on these question types than on the others while you study for the GMAT.
- To answer the questions, you must evaluate the data on three tabs. It could be necessary to contrast and compare the various sources. These inquiries are comparable to reading comprehension inquiries in the Verbal part in this regard. You must be able to identify key points, find specifics, and combine concepts.
3. Table Analysis Questions
These questions present several statements, and you’ll choose between two dichotomous answer choices, like yes/no, or true/false.
How to proceed with questions?
When answering table analysis questions, you need to take time to understand what the question is asking you to do.
Table analysis questions are not always straightforward, and you need to take some time to read the questions and statements to understand what they’re asking.
Tip: Like an Excel spreadsheet, table analysis questions let you sort columns in alphabetical or numerical order.
4. Graphics Interpretation Questions
While multi-source reasoning questions may or may not have graphics, graphics interpretation questions definitely do. You could get any kind of graph or chart, like a pie graph, line chart, bar graph, scatter plot, or some other unusual graphic. Below the graphic, you’ll get two sentences that ask you to fill in the blank. Instead of a blank line, you’ll get drop-down menus and be asked to choose among a few answer choices. As long as you can readily interpret the graphic, these questions tend to be less time-consuming than the others.
How to proceed with questions?
- To prepare for these questions, you should get comfortable reading graphs, charts, and other graphics.
- Make sure you can immediately understand what a graphic is communicating and collect data from it.
5. Two- Part Analysis
Two-part analysis questions start with some short introductory material. Then, you’ll see a chart and need to select one answer in each column. These questions can be entirely verbal or entirely mathematical. Often, you have to find your answer for one column before you’re able to figure out your answer for the other one.
Tip: Two-part analysis questions draw on both your reading comprehension and your math skills.
How to proceed with questions?
- These questions could call on your math or verbal skills; you don’t really know which.
- To prepare, you should especially develop your reading comprehension skills, so you know exactly what the two-part question is asking you to do.
- You should also review how to calculate the rate, speed, profit, and other concepts common to Quantitative word problems.
You can access the data insights course for GMAT Focus by clicking on this link.
All the best for your preparation!
|
2 videos|14 docs
|


