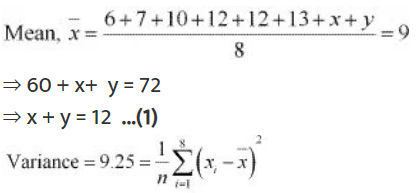
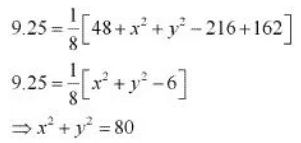
Q1: The mean and variance of eight observations are 9 and 9.25, respectively. If six of the observations are 6, 7, 10, 12, 12 and 13, find the remaining two observations.
Ans: Let the remaining two observations be x and y.
Therefore, the observations are 6, 7, 10, 12, 12, 13, x, y.
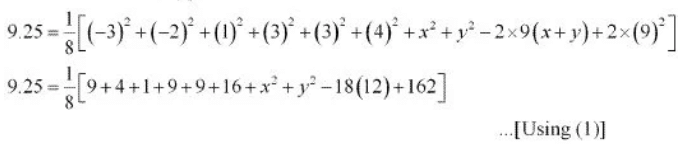
From (1), we obtain
x2 + y2 + 2xy = 144 ...(3)
From (2) and (3), we obtain
2xy = 64 ... (4)
Subtracting (4) from (2), we obtain
x2 + y2 - 2xy = 80 - 64 = 16
⇒ x - y = ± 4 ...(5)
Therefore, from (1) and (5), we obtain
x = 8 and y = 4, when x - y = 4
x = 4 and y = 8, when x - y = -4
Thus, the remaining observations are 4 and 8.
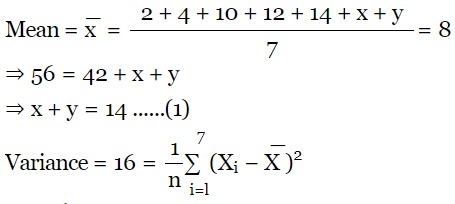
Q2: The mean and variance of 7 observations are 8 and 16, respectively. If five of the observations are 2, 4, 10, 12 and 14. Find the remaining two observations.
Ans: Let the remaining two observation be x and y
The observation are 2 , 4 , 10 , 12 , 14 , x , y
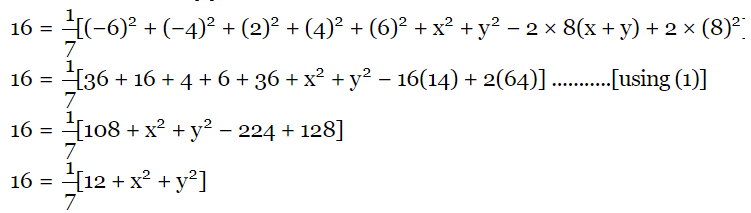
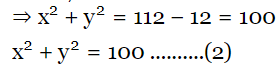
From (1), we obtain
x2 + y2 + 2xy = 196 ....(3)
From (2) and (3), we obtain
2xy = 196 - 100
⇒ 2xy = 96 ...........(4)
subtracting (4) from (2), we obtain
x2 + y2 - 2xy = 100 - 96
⇒ (x - y)2 = 4
⇒ x - y = ± 2 ............(5)
Therefore, from (1) and (5) we obtain
x = 8 and y = 6 when x - y = 2
x = 6 and y = 8 when x - y = - 2
Thus the remaining observation are 6 and 8
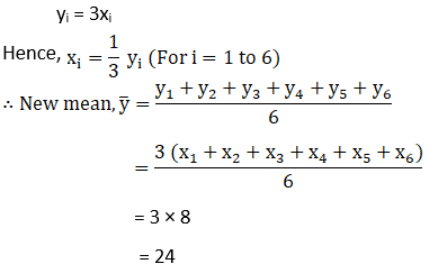
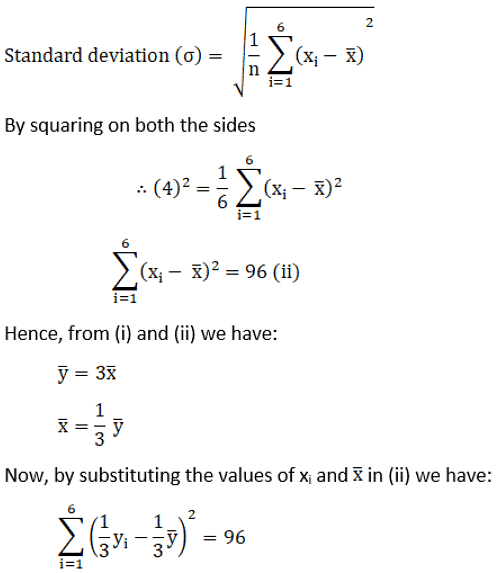
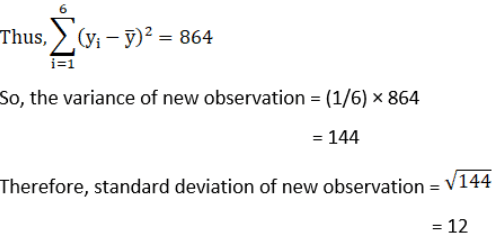
Q3: The mean and standard deviation of six observations are 8 and 4, respectively. If each observation is multiplied by 3, find the new mean and new standard deviation of the resulting observations.
Ans:
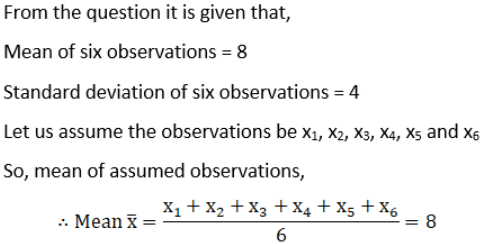
We know that,
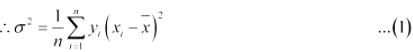
Q4: Given that  is the mean and σ2 is the variance of n observations x1, x2 ... xn. Prove that the mean and variance of the observations ax1, ax2, ax3 ...axn are ax and a2 σ2, respectively (a ≠ 0).
Ans: The given n observations are x1, x2 ... xn.
Mean =
Variance = σ2
If each observation is multiplied by a and the new observations are yi, then
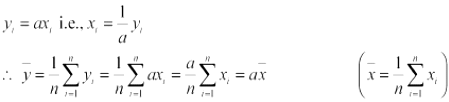
Therefore, mean of the observations, ax1, ax2 ... axn, is
Substituting the values of xiand  in (1), we obtain
Thus, the variance of the observations, ax1, ax2 ... axn, is a2 σ2.
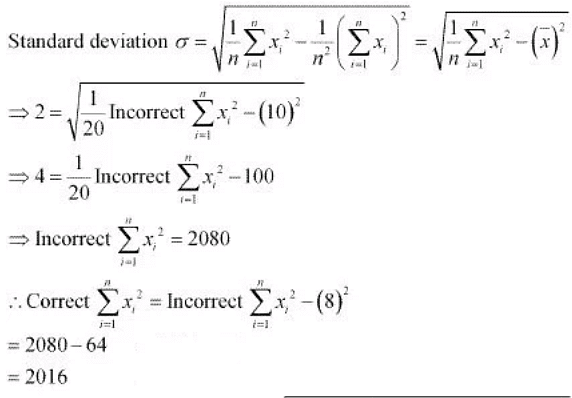
Q5: The mean and standard deviation of 20 observations are found to be 10 and 2, respectively. On rechecking, it was found that an observation 8 was incorrect. Calculate the correct mean and standard deviation in each of the following cases:
(i) If wrong item is omitted.
(ii) If it is replaced by 12.
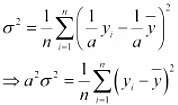
Ans: (i) Number of observations (n) = 20
Incorrect mean = 10
Incorrect standard deviation = 2
That is, incorrect sum of observations = 200
Correct sum of observations = 200 - 8 = 192
Correct mean = (Correct sum )/19 = 192/19 = 10.1
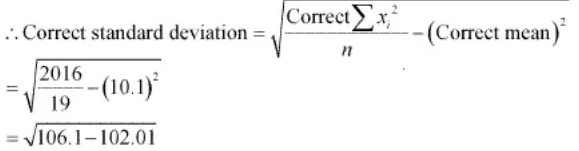
= √4.09
= 2.02
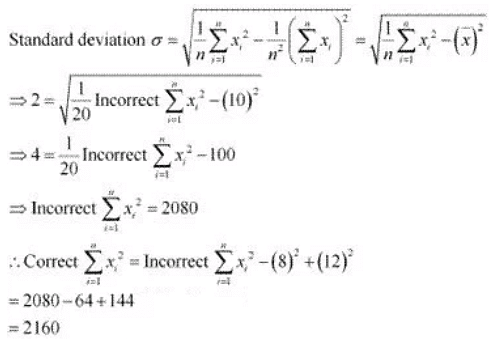
(ii) When 8 is replaced by 12,
Incorrect sum of observations = 200
Correct sum of observations = 200 - 8 + 12 = 204
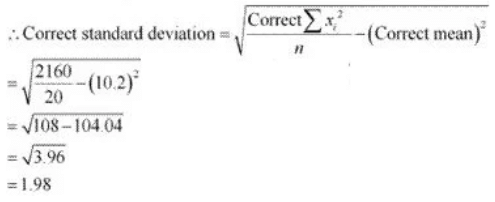
∴ Correct mean = (Correct sum)/20 = 204/20 = 10.2
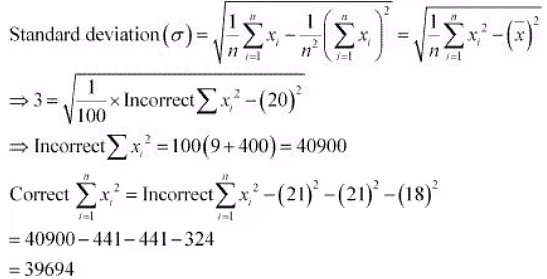
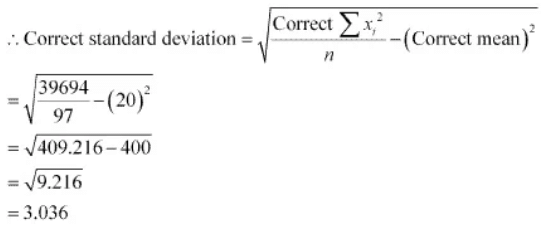
Q6: The mean and standard deviation of a group of 100 observations were found to be 20 and 3, respectively. Later on it was found that three observations were incorrect, which were recorded as 21, 21 and 18. Find the mean and standard deviation if the incorrect observations are omitted.
Ans: Number of observations (n) = 100
Incorrect mean  = 20Incorrect standard deviation (σ) = 3
Incorrect sum of observations = 2000
Correct sum of observations = 2000 - 21 - 21 - 18 = 2000 - 60 = 1940
∴ Correct mean = (correct sum)/(100 - 3) = 1940/97 = 20