Maxwell Boltzmann Distribution Curve | Chemistry for EmSAT Achieve PDF Download
What is the Maxwell-Boltzmann distribution?
The air molecules surrounding us are not all traveling at the same speed, even if the air is all at a single temperature. Some of the air molecules will be moving extremely fast, some will be moving with moderate speeds, and some of the air molecules will hardly be moving at all. Because of this, we can't ask questions like "What is the speed of an air molecule in a gas?" since a molecule in a gas could have any one of a huge number of possible speeds.
So instead of asking about any one particular gas molecule, we ask questions like, "What is the distribution of speeds in a gas at a certain temperature?" In the mid to late 1800s, James Clerk Maxwell and Ludwig Boltzmann figured out the answer to this question. Their result is referred to as the Maxwell-Boltzmann distribution , because it shows how the speeds of molecules are distributed for an ideal gas. The Maxwell-Boltzmann distribution is often represented with the following graph.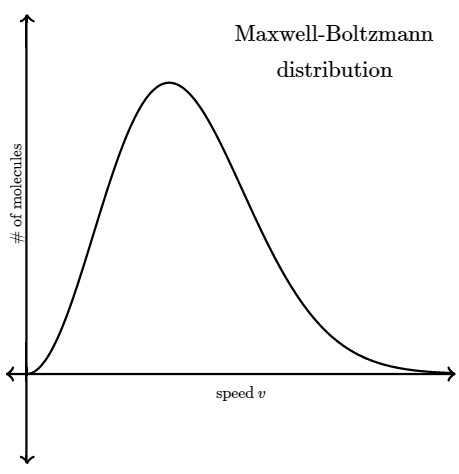
The y-axis of the Maxwell-Boltzmann graph can be thought of as giving the number of molecules per unit speed. So, if the graph is higher in a given region, it means that there are more gas molecules moving with those speeds.
Notice that the graph is not symmetrical. There is a longer "tail" on the high speed right end of the graph. The graph continues to the right to extremely large speeds, but to the left the graph must end at zero (since a molecule can't have a speed less than zero).
The actual mathematical equation for the Maxwell-Boltzmann distribution is a little intimidating and not typically needed for many introductory algebra classes.
What does root-mean-square speed mean?
You might think that the speed located directly under the peak of the Maxwell-Boltzmann graph is the average speed of a molecule in the gas, but that's not true. The speed located directly under the peak is the most probable speed vp, since it is the speed that is most likely to be found for a molecule in a gas.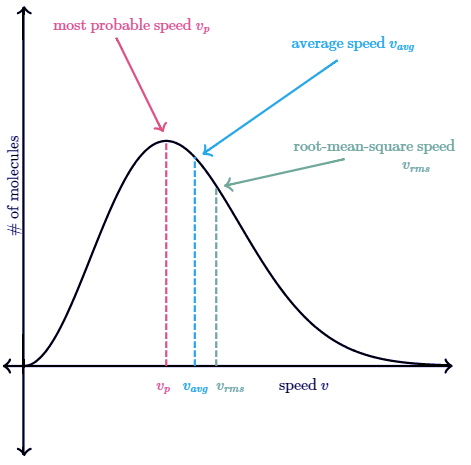 The average speed vaug of a molecule in the gas is actually located a bit to the right of the peak. The reason the average speed is located to the right of the peak is due to the longer "tail" on the right side of the Maxwell-Boltzmann distribution graph. This longer tail pulls the average speed slightly to the right of the peak of the graph.
Another useful quantity is known as the root-mean-square speed Urms. This quantity is interesting because the definition is hidden in the name itself. The root-mean-square speed is the square root of the mean of the squares of the velocities. Mean is just another word for average here. We can write the root- mean-square speed mathematically as, It might seem like this technique of finding an average value is unnecessarily complicated since we squared all the velocities, only to later take a square root. You might wonder, "Why not just take an average of the velocities?" But remember that velocity is a vector and has a direction. The average gas molecule velocity is zero, since there are just as many gas molecules going right (+ velocity) as there are going left (- velocity). This is why we square the velocities first, making them all positive. This ensures that taking the mean (i.e. average value) will not give us zero. Physicists use this trick often to find average values over quantities that can take positive and negative values (e.g. voltage and current in an alternating current circuit).
It should be noted that all three of these quantities (Up, Vavg, and Urms) are quite large, even for a gas at room temperature. For example, Neon gas at room temperature (293 K) has a most probable speed, average speed, and root- mean-square speed of about,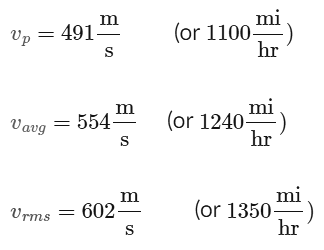
What does the area under a Maxwell-Boltzmann distribution represent?
The y-axis of the Maxwell-Boltzmann distribution graph gives the number of molecules per unit speed. The total area under the entire curve is equal to the total number of molecules in the gas.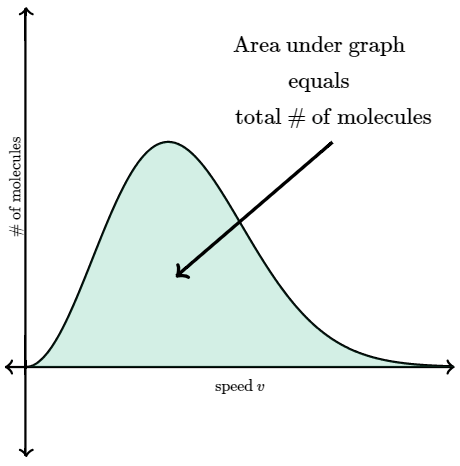
If we heat the gas to a higher temperature, the peak of the graph will shift to the right (since the average molecular speed will increase). As the graph shifts to the right, the height of the graph has to decrease in order to maintain the same total area under the curve. Similarly, as a gas cools to a lower temperature, the peak of the graph shifts to the left. As the graph shifts to the left, the height of the graph has to increase in order to maintain the same area under the curve. This can be seen in the curves below which represent a sample of gas (with a constant amount of molecules) at different temperatures.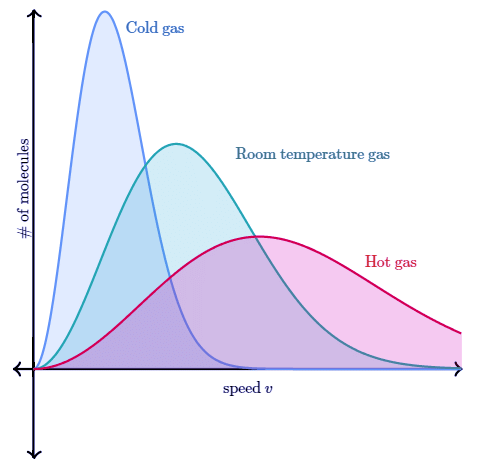
As the gas gets colder, the graph becomes taller and more narrow. Similarly, as the gas gets hotter the graph becomes shorter and wider. This is required for the area under the curve (i.e. total number of molecules) to stay constant. If molecules enter the sample, the total area under the curve would increase. Similarly, if molecules were to leave the sample, the total area under the curve would decrease.
|
191 videos|265 docs|160 tests
|
FAQs on Maxwell Boltzmann Distribution Curve - Chemistry for EmSAT Achieve
| 1. What is the significance of the Root-Mean-Square Speed in the context of the Maxwell-Boltzmann distribution? |  |
| 2. How does the area under a Maxwell-Boltzmann Distribution curve relate to the total number of particles in a gas sample? |  |
| 3. How can the Root-Mean-Square Speed be calculated from a Maxwell-Boltzmann Distribution curve? |  |
| 4. What is the relationship between the Average Kinetic Energy and the Root-Mean-Square Speed in a gas sample? |  |
| 5. How does the understanding of Particle Speeds in Physics impact the study of Kinetic Theory at different scales? |  |


