Problem Scoping Important Notes | Artificial Intelligence for Class 10 PDF Download
| Table of contents |
|
| Problem Scoping |
|
| Data Acquisition |
|
| Data Exploration |
|
| Modelling |
|
| Evaluation |
|
Problem Scoping
Whenever we begin a new project, we encounter a number of challenges. In fact, we are surrounded with issues! These issues might be minor or major; sometimes we overlook them, and other times we require immediate attention.
To understand a problem, determine the different aspects that affect the problem, and define the project’s goal are problem scoping.
How to Identify the Problem Scoping in AI Project
Follow the following steps to identify the problem scoping from the project –
- Understand why the project was started.
- Define the project’s primary objectives.
- Outline the project’s work statement.
- Determine the most important goals.
- Choose important milestones.
- Determine the major constraints.
- Make a list of scope exclusions.
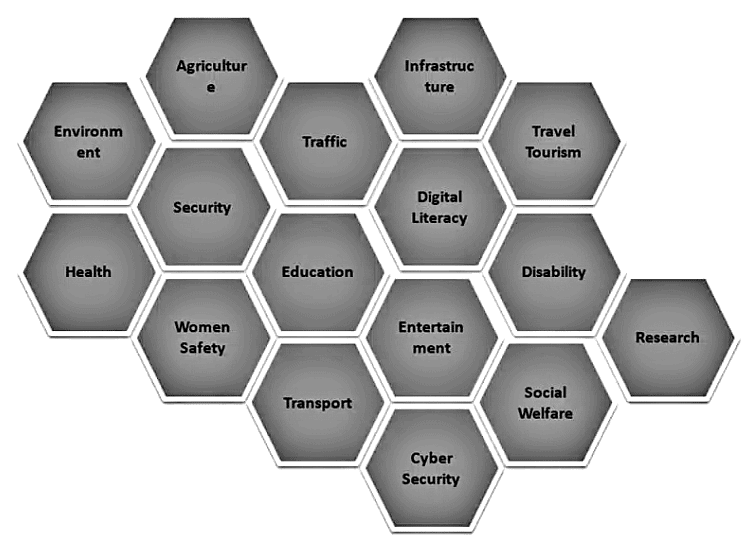
Acquiring Data from following Source
4Ws Problem Canvas
The 4 W’s of Problem Scoping are Who, What, Where, and Why. This 4 W’s helps to identify and understand the problem in a better manner.
- Who – The “Who” element helps us to understand and categorize who is directly and indirectly affected by the problem, and who are known as Stakeholders.
- What – The “What” section aids us in analyzing and recognizing the nature of the problem, and you may also gather evidence to establish that the problem you’ve chosen exists under this block.
- Where – What is the situation, and where does the problem arise.
- Why – Refers to why we need to address the problem and what the advantages will be for the stakeholders once the problem is solved.
Statement of the Problem Template
After you’ve completed the above 4Ws, make a summary of what you’ve learned. The problem statement template is the name for this summary. This template summarizes all of the important points in one place. So, if the same problem comes again, this statement will make it much easier to fix.
Problem Statement Template with space to fill details according to your Goal: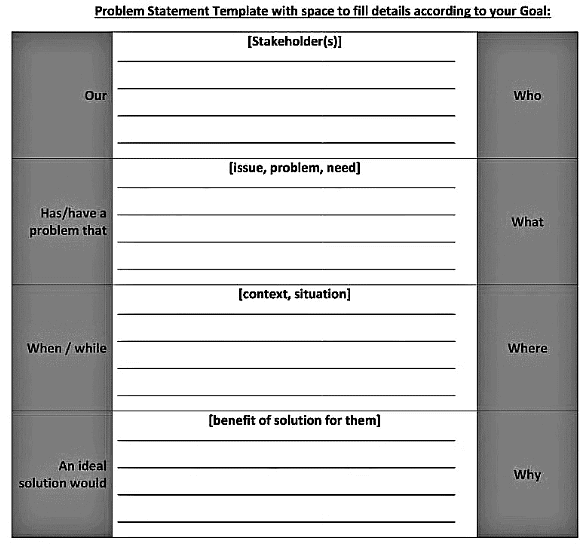
Data Acquisition
The method of collecting correct and dependable data to work with is known as data acquisition. Data can be in the form of text, video, photos, audio, and so on, and it can be gathered from a variety of places such as websites, journals, and newspapers.
What is Data
Data is a representation of facts or instructions about an entity that can be processed or conveyed by a human or a machine, such as numbers, text, pictures, audio clips, videos, and so on.
There is two type of data –
- Structured Data
- Unstructured Data
a. Structured Data
When data is in a standardized format, has a well-defined structure, follows a consistent order, and is easily accessible by humans and program. This data is in the form of numbers, characters, special characters etc.
b. Unstructured Data
Unstructured data is information that doesn’t follow traditional data models and is therefore difficult to store and manage. Video, audio, and image files, as well as log files, are all examples of unstructured data.
Dataset
Dataset is a collection of data in tabular format. Dataset contains numbers or values that are related to a specific subject. For example, students’ test scores in a class is a dataset.
The dataset is divided into two parts
- Training dataset – Training dataset is a large dataset that teaches a machine learning model. Machine learning algorithms are trained to make judgments or perform a task through training datasets. Maximum part of the dataset comes under training data (Usually 80%)
- Test dataset – Data that has been clearly identified for use in tests, usually of a computer program, is known as test data. 20% of data used in test data
Acquiring Data from Reliable Sources
There are six ways to collect data.
- Surveys: A research method for gathering data from a predetermined sample of respondents in order to get knowledge and insights into a variety of issues.
- Cameras: We can collect visual data with the help of cameras, this data is unstructured data that can be analyzed via Machine learning.
- Web Scripting: Web scribing is a technique for collecting structured data from the internet, such as news monitoring, market research, and price tracking.
- Observation: Some of the information we can gather through attentive observation and monitoring.
- Sensors: With the help of sensors also we can collect the data. A device that detects or measures a physical property are called sensors, such as biomatrix.
- Application program interface: An API is a software interface that enables two apps to communicate with one another.
How to create a System Map with example of Water Cycle.
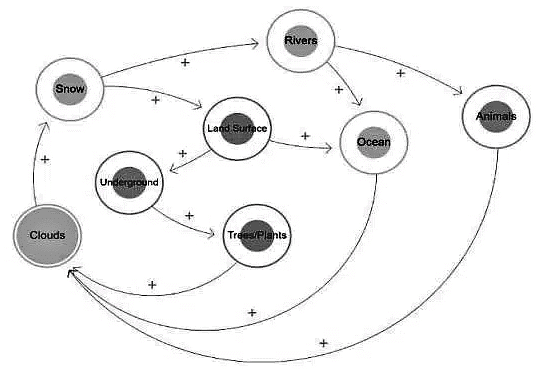
- All of the constituents of the Water Cycle are circled in this System Map. With the help of arrows, the map depicts the cause and effect relationships between elements. The arrowhead represents the effect’s direction, while the (+ or -) indicates their relationship. If the arrow with the + sign goes from X to Y, it suggests the two are directly related.
- That is, as X rises, Y rises as well, and vice versa. If the arrow, on the other hand, goes with a – sign between X and Y, it signifies that both elements are inversely connected.
- This means that while X increases, Y decreases, and vice versa.
- Now, it’s your turn to build your own System Map!
Data Exploration
- In order to better understand the nature of the data, data analysts utilize data visualization and statistical tools to convey dataset characterizations, such as size, amount, and accuracy.
- Data exploration is a technique used to visualize data in the form of statistical methods or using graphs.
Why Data Exploration
Exploration helps you gain a better understanding of a dataset, making it easier to explore and use it later. It also helps to quickly understand the data’s trends, and patterns.
About Data Visualization Chart
Data visualization charts are graphical representations of data that use symbols to convey a story and help people understand large volumes of information.
- Column Chart – A column chart is a basic Visualization chart that uses vertical columns to represent data series. Because column lengths are easy to compare, column charts are an effective approach to demonstrate the changes in the data.
- Bar Chart – A bar chart is a visual representation of category data. The data is displayed in a bar chart with multiple bars, each representing a different category.
Modelling
AL, ML & DL
Venn Diagram of AI
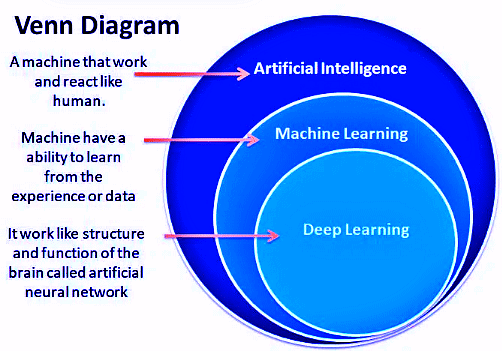
Artificial Intelligence: Artificial intelligence (AI) is the simulation of human intelligence in robots that have been trained to think and act like humans. The term can also refer to any machine that demonstrates, like humans, the ability to learn and solve the problem is Artificial Intelligence.
Machine Learning: Machine learning is a part of an Artificial Intelligence application in which we give data to the machine and allow them to learn for themselves. It’s essentially getting a machine to accomplish something without being specifically programmed to do so.
Deep Learning: Deep learning is a part of Artificial Intelligence that uses neural networks with multilayer. Deep learning analyzes the data, learns the data and solves the problem the same as a human. Deep learning requires the machine to be educated with a large quantity of data in order to train itself.
Rule Based
The rule-based approach to AI modeling is when the developer defines the relationship or patterns in data. The machine follows the developer’s rules or instructions and completes its job properly.
What is Modeling
An AI model is a program that has been trained to recognize patterns using a set of data. AI modeling is the process of creating algorithms, also known as models, that may be educated to produce intelligent results. This is the process of programming code to create a machine artificially.
Rule Based AI Model (Decision Tree)

Learning Based Approach
Refers to AI modeling in which the developer hasn’t specified the relationship or patterns in the data. Random data is provided to the computer in this method, and the system is left to figure out patterns and trends from it. When the data is unlabeled and too random for a human to make sense of, this method is usually used.
Decision Tree in AI
The concept of Decision Trees is similar to that of Story Speaker. It’s a rule-based AI model that uses numerous judgments (or rules) to assist the machine in determining what an element is. The following is the basic structure of a decision tree:
Points to Remember
When creating Decision Trees, one should carefully examine the dataset provided and try to determine what pattern the output leaf follows. Try picking one output and figuring out the common links that all similar outputs have based on it.
When building a decision tree, it’s common for the dataset to have redundant material that’s of no use. As a result, you should make a list of the parameters that directly affect the output and use only those when designing a decision tree.
For a single dataset, there may be several decision trees that lead to correct prediction. The most straightforward option should be selected.
Evaluation
After a model has been created and trained, it must be thoroughly tested in order to determine its efficiency and performance; this is known as evaluation.
|
40 videos|35 docs|6 tests
|
FAQs on Problem Scoping Important Notes - Artificial Intelligence for Class 10
| 1. What is the importance of problem scoping in the data science process? |  |
| 2. How does data acquisition play a role in the data science process? | |
| 3. What are some common techniques used for data exploration in data science? | |
| 4. How is modeling approached in the data science process? | |
| 5. How is the evaluation of models conducted in data science projects? | |

|
4.89/5 Rating |

|
Dec 23, 2024 Last updated |

|
Explore Courses for Class 10 exam
|
|
mock tests for examination
,past year papers
,Summary
,Problem Scoping Important Notes | Artificial Intelligence for Class 10
,Objective type Questions
,Previous Year Questions with Solutions
,Problem Scoping Important Notes | Artificial Intelligence for Class 10
,Semester Notes
,Problem Scoping Important Notes | Artificial Intelligence for Class 10
,shortcuts and tricks
,practice quizzes
,Viva Questions
,Sample Paper
,ppt
,Exam
,Free
,study material
,Important questions
,Extra Questions
,video lectures
,MCQs
,


Important Notes: Problem Scoping Free PDF Download
Importance of Important Notes: Problem Scoping
Important Notes: Problem Scoping
Important Notes: Problem Scoping Class 10 Questions
Study Important Notes: Problem Scoping on the App
|
© EduRev
|
Education Revolution
|


|


