IGCSE Year 10 > Year 10 Notes > Economics for GCSE/ > Supply, Price & Quantity
Supply, Price & Quantity

Introduction to Supply
- Supply in economics refers to the quantity of a specific good or service that producers are willing and able to provide at various prices during a specified period.
- When represented graphically, the supply curve illustrates the relationship between price levels and the quantity of a good or service that producers are are willing to supply in the market.
- While in reality, the data may form a curve, economists often use straight lines to create supply curves for simplicity and ease of analysis.
- The upward slope of the supply curve indicates a positive correlation between price and the quantity supplied by producers. As prices increase, rational producers seek to supply more to maximize their profits.
Individual & Market Supply
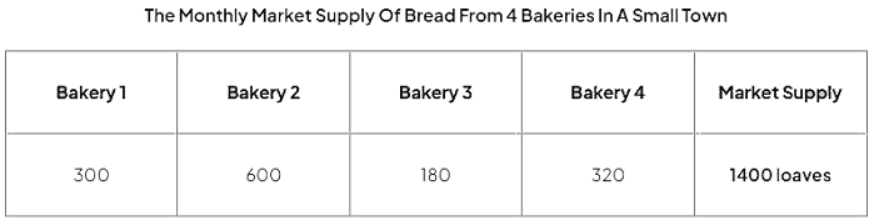
- Market supply represents the collective sum of all individual supplies for a particular good or service.
- It is determined by aggregating the individual supply quantities across various price levels.
- Calculating market supply involves summing up the quantities supplied by each seller at different price points.
- At each price level, the total supply from all suppliers contributes to the overall market supply.
- Individual and market supply can also be depicted visually through graphs:
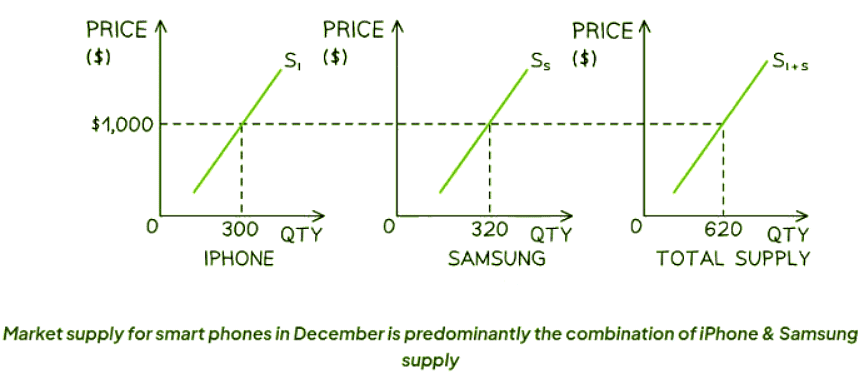
- Diagram Analysis:
- In New York City, the market supply for smartphones in December is primarily the combination of iPhone & Samsung supply.
- At a price of $1000, the supply of iPhones is 300 units, and the supply of Samsung phones is 320 units.
- At a price of $1,000, the market supply of smartphones in New York City during December is 620 units.
MULTIPLE CHOICE QUESTIONTry yourself: What does the upward slope of the supply curve indicate?
Movements Along a Supply Curve
- If price is the only factor that changes (ceteris paribus), there will be a change in the quantity supplied (QS). This change is shown by a movement along the supply curve.
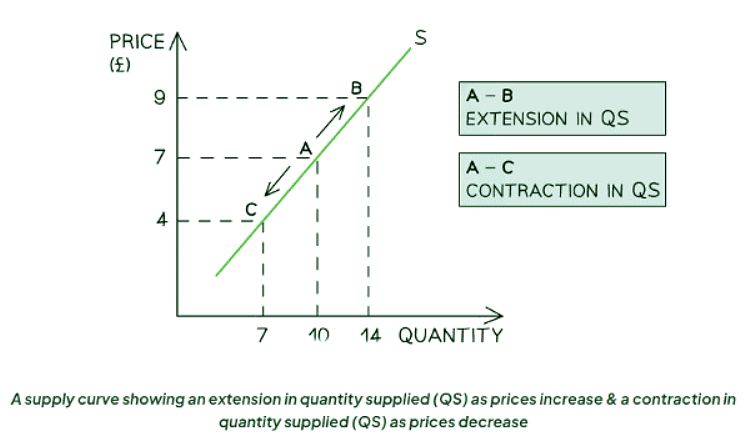
Diagram Analysis:
- An Increase in Price:
- When the price increases from £7 to £9, it results in a movement up the supply curve from point A to B.
- This price increase leads to a rise in the quantity supplied from 10 to 14 units, known as an extension in quantity supplied (QS).
- For example, if the price of oranges increases from £1 to £2 per orange, farmers might decide to supply more oranges to the market.
- A Decrease in Price:
- If the price decreases from £7 to £4, there is a movement down the supply curve from point A to C.
- This price drop causes a decrease in the quantity supplied from 10 to 7 units, referred to as a contraction in quantity supplied (QS).
- For instance, if the price of laptops falls, suppliers may reduce the number of laptops they are willing to supply.
The document Supply, Price & Quantity is a part of the Year 10 Course Economics for GCSE/IGCSE.
All you need of Year 10 at this link: Year 10
FAQs on Supply, Price & Quantity
| 1. How do movements along a supply curve represent changes in price and quantity supplied? |  |
Ans. Movements along a supply curve represent changes in price and quantity supplied. As the price of a good or service increases, the quantity supplied by producers also increases, leading to a movement up along the supply curve. Conversely, if the price decreases, the quantity supplied decreases, resulting in a movement down along the supply curve.
| 2. What factors can cause a shift in the supply curve? | |
Ans. Factors that can cause a shift in the supply curve include changes in production costs (such as wages or raw material prices), technology advancements, government regulations, weather conditions (for agricultural products), and expectations of future prices. These factors can lead to an increase or decrease in the overall supply of a good or service, shifting the supply curve to the right or left.
| 3. How does the law of supply relate to the concept of supply movements along a supply curve? | |
Ans. The law of supply states that as the price of a good or service increases, the quantity supplied by producers also increases, ceteris paribus. This means that there is a direct relationship between price and quantity supplied. Movements along a supply curve illustrate this relationship, showing how changes in price impact the quantity supplied by producers.
| 4. Can a change in the quantity supplied be caused by factors other than price? | |
Ans. Yes, a change in the quantity supplied can be caused by factors other than price. For example, if there is a technological advancement that increases the efficiency of production, producers may be able to supply more of a good or service at the same price. In this case, the quantity supplied would increase, even if the price remains constant.
| 5. How can producers use supply curve analysis to make pricing decisions? | |
Ans. Producers can use supply curve analysis to make pricing decisions by understanding how changes in price affect the quantity supplied. By analyzing their production costs, expected demand, and competitor pricing, producers can determine the optimal price point that maximizes their profits. They can also use supply curve analysis to predict how changes in the market will impact their supply levels and adjust their pricing strategy accordingly.
About this Document

4.76/5 Rating

Apr 29, 2026 Last updated
Related Exams
Document Description: Supply, Price & Quantity for Year 10 2026 is part of Economics for GCSE/IGCSE preparation. The notes and questions for Supply, Price & Quantity have been prepared according to the Year 10 exam syllabus. Information about Supply, Price & Quantity covers topics like and Supply, Price & Quantity Example, for Year 10 2026 Exam. Find important definitions, questions, notes, meanings, examples, exercises and tests below for Supply, Price & Quantity.
Introduction of Supply, Price & Quantity in English is available as part of our Economics for GCSE/IGCSE for Year 10 & Supply, Price & Quantity in Hindi for Economics for GCSE/IGCSE course. Download more important topics related with notes, lectures and mock test series for Year 10 Exam by signing up for free. Year 10: Supply, Price & Quantity
Description
Supply, Price & Quantity of Economics covers all the important topics, helping you prepare for the Year 10 exam on EduRev. Start for free!
Information about Supply, Price & Quantity
In this doc you can find the meaning of Supply, Price & Quantity defined & explained in the simplest way possible. Besides explaining types of Supply, Price & Quantity theory, EduRev gives you an ample number of questions to practice Supply, Price & Quantity tests, examples and also practice Year 10 tests


Related Searches
Previous Year Questions with Solutions, shortcuts and tricks, Important questions, Free, practice quizzes, mock tests for examination, Price & Quantity, Summary, Sample Paper, Supply, past year papers, Objective type Questions, Semester Notes, ppt, Supply, Extra Questions, Price & Quantity, Price & Quantity, pdf , Exam, study material, Viva Questions, MCQs, Supply, video lectures;