IGCSE Class 10 > Class 10 Notes > Physics for GCSE/ > Calculating Acceleration from Speed-Time Graphs
Calculating Acceleration from Speed-Time Graphs

Interpreting Speed-Time graphs
- If there is a change in an object's speed, then it is accelerating
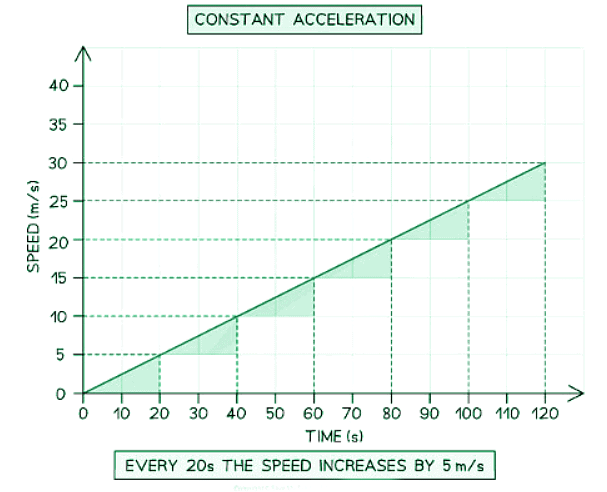
- An object may accelerate at a steady rate, this is called constant acceleration.
- On a speed-time graph, constant acceleration is shown as a non-horizontal straight line.
- An object may accelerate at an increasing rate.
- On a speed-time graph, this would be shown as an upward curve with an increasing gradient.
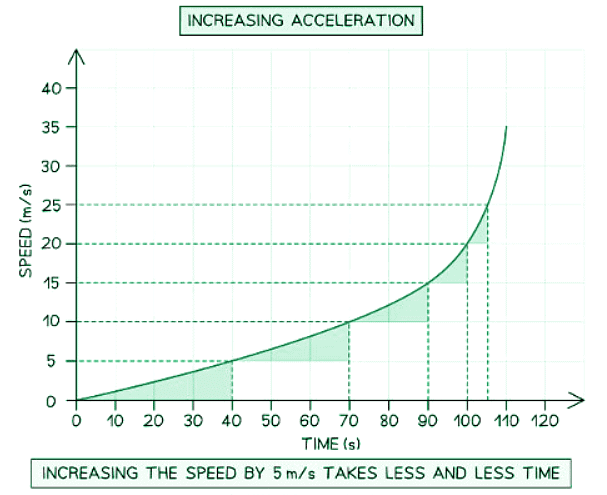
- On a speed-time graph, this would be shown as an upward curve with an increasing gradient.
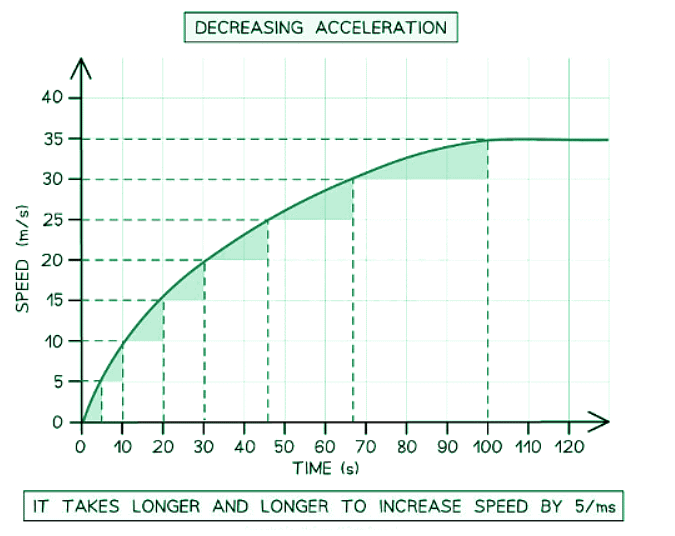
- Objects can also accelerate at a decreasing rate, which is represented by an upward curve on a speed-time graph with a gradually lessening gradient.
Understanding Deceleration
- Deceleration occurs when an object's speed decreases over time, resulting in a negative acceleration.
- On a speed-time graph, deceleration is represented by a downward line.
- It can be constant, increasing, or decreasing depending on the shape of the curve.
- Example: Imagine a car hitting the brakes and gradually coming to a stop. The corresponding speed-time graph would show a downward line illustrating deceleration.
MULTIPLE CHOICE QUESTIONTry yourself: What does a non-horizontal straight line on a speed-time graph indicate?
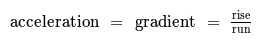
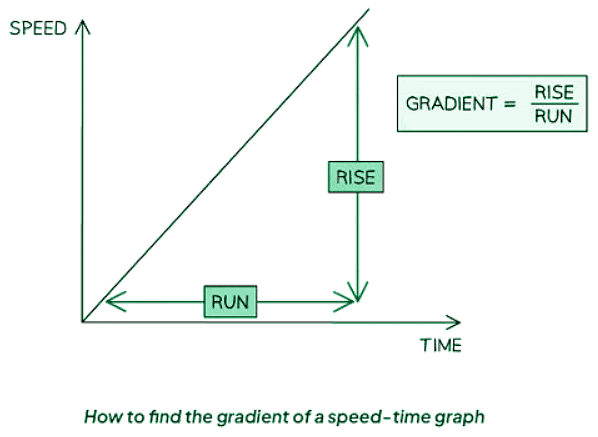
Calculating Acceleration
- The acceleration of an object can be determined by analyzing the slope of a graph depicting its speed over time.
The document Calculating Acceleration from Speed-Time Graphs is a part of the Class 10 Course Physics for GCSE/IGCSE.
All you need of Class 10 at this link: Class 10
FAQs on Calculating Acceleration from Speed-Time Graphs
| 1. How do you calculate acceleration from a speed-time graph? |  |
Ans. To calculate acceleration from a speed-time graph, you need to find the slope of the graph. The slope of the graph represents the rate of change of speed, which is the acceleration. The steeper the slope, the greater the acceleration.
| 2. What does a horizontal line on a speed-time graph indicate about acceleration? | |
Ans. A horizontal line on a speed-time graph indicates that the object is moving at a constant speed, with zero acceleration. This is because there is no change in speed over time when the line is horizontal.
| 3. How can you determine if an object is accelerating or decelerating from a speed-time graph? | |
Ans. If the speed-time graph has a positive slope, the object is accelerating. If the slope is negative, the object is decelerating. A flat line indicates constant speed with zero acceleration.
| 4. Can acceleration be calculated at a specific point on a speed-time graph? | |
Ans. Yes, acceleration can be calculated at a specific point on a speed-time graph by finding the slope of the tangent line to the curve at that point. The steeper the tangent line, the greater the acceleration at that specific point.
| 5. How does the shape of a speed-time graph affect the acceleration of an object? | |
Ans. The shape of a speed-time graph can indicate different types of acceleration. For example, a curve on the graph may represent changing acceleration, while a straight line may indicate constant acceleration. The steepness of the curve or line also reflects the magnitude of acceleration.
About this Document

4.96/5 Rating

Apr 21, 2026 Last updated
Related Exams
Document Description: Calculating Acceleration from Speed-Time Graphs for Class 10 2026 is part of Physics for GCSE/IGCSE preparation. The notes and questions for Calculating Acceleration from Speed-Time Graphs have been prepared according to the Class 10 exam syllabus. Information about Calculating Acceleration from Speed-Time Graphs covers topics like and Calculating Acceleration from Speed-Time Graphs Example, for Class 10 2026 Exam. Find important definitions, questions, notes, meanings, examples, exercises and tests below for Calculating Acceleration from Speed-Time Graphs.
Introduction of Calculating Acceleration from Speed-Time Graphs in English is available as part of our Physics for GCSE/IGCSE for Class 10 & Calculating Acceleration from Speed-Time Graphs in Hindi for Physics for GCSE/IGCSE course. Download more important topics related with notes, lectures and mock test series for Class 10 Exam by signing up for free. Class 10: Calculating Acceleration from Speed-Time Graphs
Description
Calculating Acceleration from Speed of Physics covers all the important topics, helping you prepare for the Class 10 exam on EduRev. Start for free!
Information about Calculating Acceleration from Speed-Time Graphs
In this doc you can find the meaning of Calculating Acceleration from Speed-Time Graphs defined & explained in the simplest way possible. Besides explaining types of Calculating Acceleration from Speed-Time Graphs theory, EduRev gives you an ample number of questions to practice Calculating Acceleration from Speed-Time Graphs tests, examples and also practice Class 10 tests


Related Searches
Free, Viva Questions, ppt, Semester Notes, Objective type Questions, Calculating Acceleration from Speed-Time Graphs, Calculating Acceleration from Speed-Time Graphs, study material, Previous Year Questions with Solutions, Extra Questions, video lectures, shortcuts and tricks, past year papers, Exam, Important questions, practice quizzes, MCQs, mock tests for examination, Summary, pdf , Calculating Acceleration from Speed-Time Graphs, Sample Paper;