Non Linear Functions | Mathematics for Digital SAT PDF Download
| Table of contents |

|
| What is a Nonlinear Function? |

|
| Nonlinear Function Table |

|
| Nonlinear Function Equation |

|
| Non linear Graphs |

|
| Linear and Nonlinear Functions |

|
| Nonlinear Function Examples |

|
What is a Nonlinear Function?
A nonlinear function is a function whose graph is NOT a straight line. Its graph can be any curve other than a straight line. For example, if there are 100 fishes in a pond initially and they become double every week, then this situation can be modeled by the function f(x) = 100 (2)x, where x is the number of weeks and f(x) is the number of fishes. Let us make a table and graph this function making use of the table.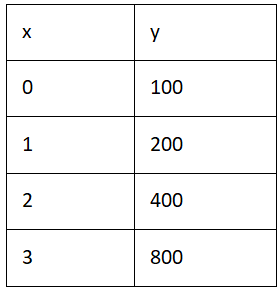
Let's graph the table now.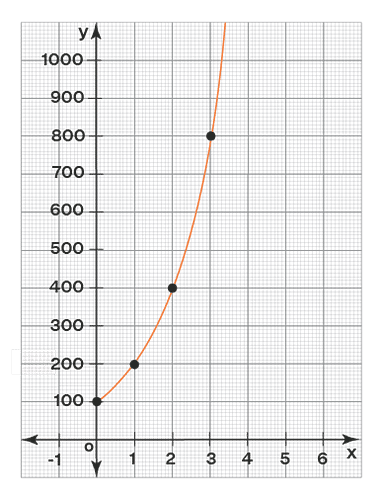
The above graph is NOT a line and hence it represents a nonlinear function. From the above graph, we can say that the slope is not uniform on a nonlinear function. A nonlinear function can be described using a table of values, an equation, or a graph. Let us see each of them now. Some of the examples of non linear functions include quadratic functions, cubic functions, polynomial functions.
Nonlinear Function Table
The steps to determine whether a table of values determine a linear function are:
- Find the differences between every two consecutive x values.
- Find the differences between every two consecutive y values.
- Find the corresponding ratios of differences of y and differences of x.
- If all the ratios are NOT same, then only the function is linear.
Consider the following table of values.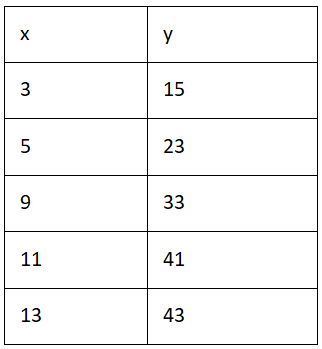
Let us determine whether this table denotes a nonlinear function by using the steps mentioned above.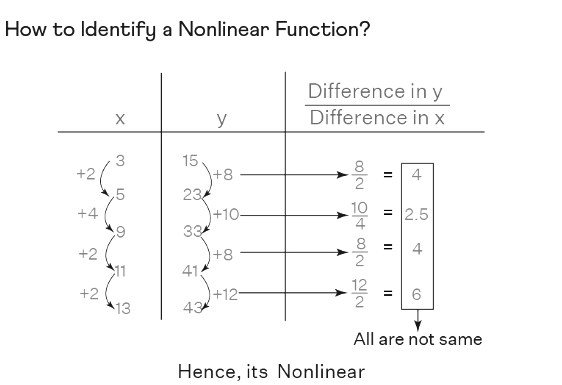
Since all the ratios of differences of y to the differences of x are NOT same, the function is a nonlinear function.
Nonlinear Function Equation
A linear function is of the form f(x) = ax + b. Since a nonlinear function is a function that is not a linear, its equation can be anything that is NOT of the form f(x) = ax+b. Some examples of nonlinear functions are:
- f(x) = x2 is nonlinear as it is a quadratic function.
- f(x) = 2x is nonlinear as it is an exponential function.
- f(x) = x3 - 3x is nonlinear as it is a cubic function.
Non linear Graphs
Since a function that is NOT linear is being called as a nonlinear function, any function whose graph is NOT a straight line should represent a nonlinear function. In the following figure, all graphs represent nonlinear functions as they are NOT straight lines.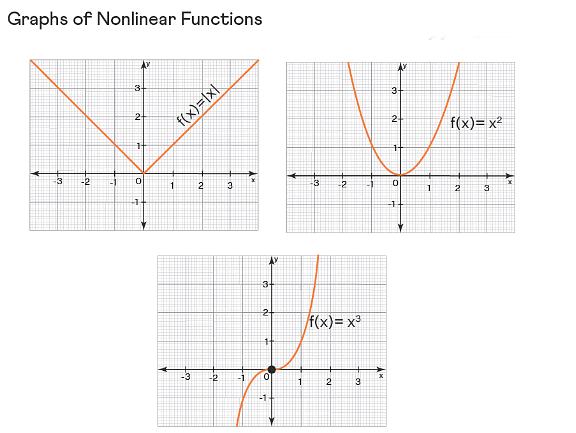
Linear and Nonlinear Functions
Here are the differences between linear and nonlinear functions.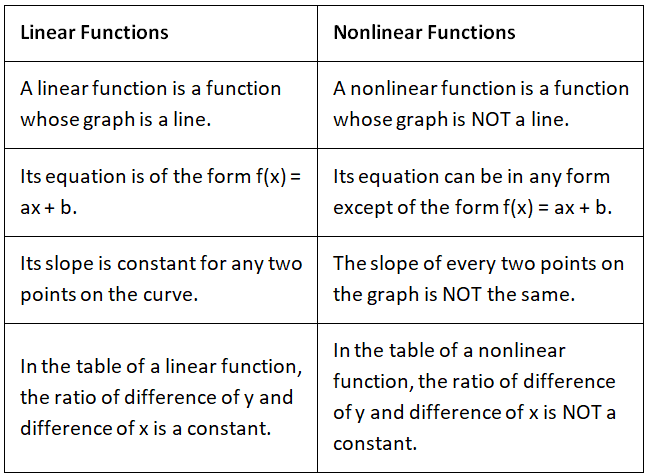
Tips and Tricks on Nonlinear Functions
- If the graph of a function is NOT a line, its nonlinear.
- If the equation of a function is NOT of the form f(x) = ax + b, then its nonlinear.
- The objective function z = ax + by may be a linear function or a non linear function.
- Rational functions, polynomial functions, exponential functions, logarithmic functions, etc are some examples of nonlinear functions.
Nonlinear Function Examples
Example: Does the following table represents a nonlinear function?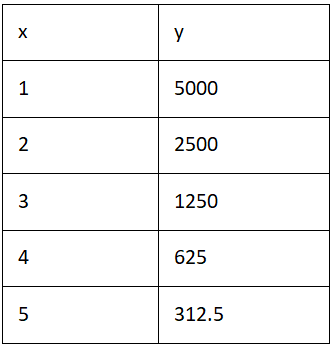 Sol: Yes.
The differences of every two successive values of x are 1, 1, 1, and 1.
The differences of every two successive values of y are -2500, -1250, -625, and -312.5.
Their corresponding ratios are -2500, -1250, -625, and -312.5, which are NOT the same.
Hence the function represented by the table is nonlinear.
|
184 videos|124 docs|75 tests
|


