Calculating Averages from Grouped Data


Key points
 Image caption
Paraphrased Information
- Grouped Frequency Table
- Grouped frequency tables are used to organize data into intervals or groups.
- They help in summarizing large amounts of data for easier analysis.
- For example, a grouped frequency table can show the distribution of ages in a population.
- Frequency Distributions
- Frequency distributions display how often different values occur in a dataset.
- They are beneficial in understanding patterns and trends within the data.
- Relative Frequencies
- Relative frequencies represent the proportion of values in a dataset.
- They are calculated by dividing the frequency of a value by the total number of values.
- For instance, in a survey, the relative frequency of people who prefer tea can be calculated.
- Cumulative Frequency
- Cumulative frequency shows the running total of frequencies up to a certain point.
- It aids in understanding the total number of observations below a specific value.
- Interpretation
- Interpreting a grouped frequency table involves analyzing the distribution of data.
- It helps in drawing conclusions about the dataset and identifying trends.
- Understanding Grouped Frequency Tables: A grouped frequency table organizes data into groups or classes. For example, a class like 10 < 𝑥 < 20 encompasses values larger than 10 up to 20. This method simplifies large datasets for analysis.
- Calculating the Mean from Grouped Data: Deriving the mean from a grouped frequency table involves estimating values. The midpoint of each group serves as this estimation since individual data points are not directly visible. By multiplying midpoints with frequencies, an approximate mean is obtained by dividing the total by the sum of frequencies.
- Identifying the Modal Class: The modal class in a grouped frequency table contains the highest frequency. It highlights the class with the most occurrences, aiding in understanding the most common data range.
- Locating the Median Class: The median class within a grouped frequency table houses the middle value or average. When there are even values, the median is the mean of the two central figures. For odd values, it is the middlemost value. This helps identify the central tendency of the dataset.
Key Theoretical Concepts
- Midpoint: The midpoint refers to the middle point between two values or coordinates. It is the center point that divides a segment into two equal parts.
- Estimate: To estimate is to make an approximate guess or provide a rough value without exact precision. It involves giving a close but not necessarily exact value.
- Frequency: Frequency indicates the number of times a particular event or observation occurs within a given dataset or period.
Modal Class
- The Modal Class, also known as the group with the highest frequency in a grouped frequency table, contains the most data points. It represents the category with the maximum occurrence.
Note: Understanding these concepts is crucial for statistical analysis and interpretation of data.
| Image 1 | Image 2 |
|---|---|
 |  |
The Modal Class
- The modal class in a grouped frequency table is the group that contains the most data points, having the highest frequency. It represents the most common data value or interval in the dataset.
The Median Class
- The median class, within a grouped frequency table, is the class interval that includes the median, which is the middle value when the data is arranged in order.
- It is calculated by finding the middle value of a dataset. If there are an even number of values, the median is the average of the two middle numbers.
- If there are 'n' values, the median is located at the (n+1)/2 position in the ordered list of values.
Median
A type of average calculated by finding the middle value of a set of numbers. If there are two middle numbers, the median is the mean of those two numbers. If there are n values, the median is the (n+1)/2th value.
- To find the modal class, identify the class with the highest frequency.
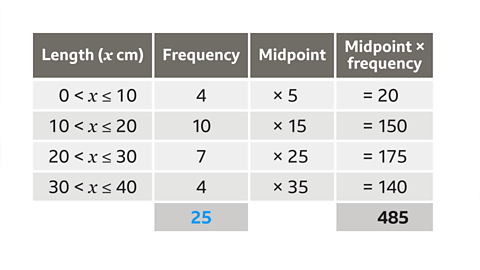 Image caption,Back to top
How to Calculate Averages in Grouped Frequency Tables
- To estimate the mean from a grouped frequency table:
- Set up a column for the midpoint of each class.
- Create another column to multiply each midpoint by its frequency.
- Calculate the sum of these multiplications to find the estimated total.
- Sum up the frequencies to determine the total number of values.
- Divide the total by the number of values to get the estimated mean.
- To identify the class containing the median:
- Locate the class with the middle value; for a dataset with 'n' values, the middle value is the 'n/2'th value.
- To determine the modal class:
- Find the class with the highest frequency.
Examples
Image gallerySkip image gallery- Example: The table displays the lengths of 25 fish. Calculate an estimate for the mean length.
 Image caption
The table shows the lengths of 25 fish. Calculate an estimate for the mean length.
Grouped Frequency Tables
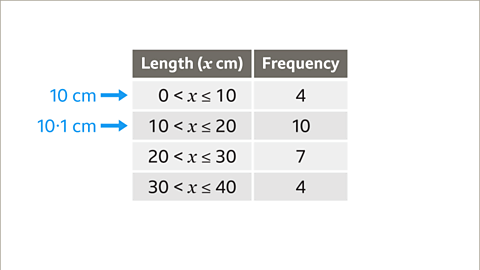
- Image caption: The 25 lengths have been grouped into four classes. The first class includes all fish longer than 0 cm but not exceeding 10 cm. For instance, a length of 10 cm falls into this category, while 10.1 cm would be in the next class.
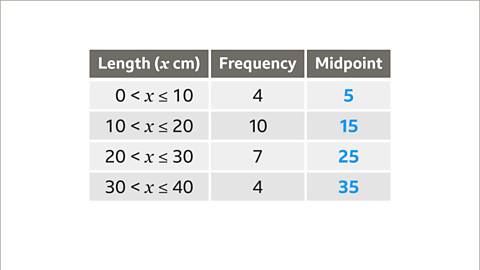
- Image caption: Data grouping necessitates estimating means. The midpoints of each group are calculated for estimation.
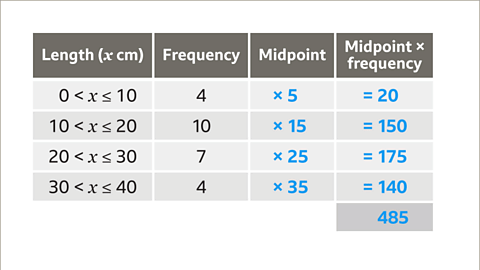
- Image caption: Estimation process involves multiplying estimated lengths by frequencies to find the total estimated length of all fish.
Understanding Grouped Frequency Tables
- Grouping lengths helps in categorizing data efficiently.
- Estimating means becomes necessary due to data grouping.
- Calculating midpoints aids in obtaining reliable estimates.
- Multiplying estimated lengths by frequencies gives a total estimated length.
Calculating Total Fish Count
- Image caption: Add all the frequencies to find the total number of fish. This may also be given in the question. There are 25 fish.
Explanation:
When analyzing the frequencies in a grouped frequency table, summing up all the frequencies reveals the total number of fish in the data set. For instance, if the frequencies provided add up to 25, it signifies that there are a total of 25 fish in the sample.
Estimating the Mean Length
- Image caption: To calculate the estimate for the mean, divide the estimated total length of all the fish (485 cm) by how many fish there are (25). The estimate for the mean length is 485 ÷ 25 = 19.4 cm.
Explanation:
When estimating the mean length of the fish, you can divide the total estimated length by the number of fish in the dataset. For example, if the total estimated length is 485 cm and there are 25 fish, the average length can be calculated by dividing 485 by 25, resulting in an estimate of 19.4 cm.
Finding the Median Length
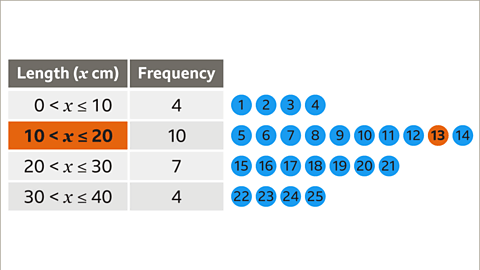
- Image caption: Work out the class that contains the median length of the 25 fish.
Explanation:
When determining the median length of the fish, it involves identifying the class that contains the middle fish's length in an ordered list from shortest to longest. If there are 25 fish, the median fish would be the 13th fish in the list.
In general, to find the median value in a dataset with n values, you locate the (n+1)/2-th value when the dataset is arranged in ascending order.
Educational Concepts in Fish Length Analysis
The analysis of fish length involves statistical methods to understand the distribution of fish lengths in a given dataset.
Finding the Median Length
- When determining the median length, locate the group that encompasses the 13th fish in the dataset. For instance, if there are 4 fish with lengths up to 10 cm and 10 fish with lengths between 10 and 20 cm, the 13th fish falls within the 10 to 20 cm range. Therefore, the class containing the median length is 10 < 𝑥 ≤ 20.
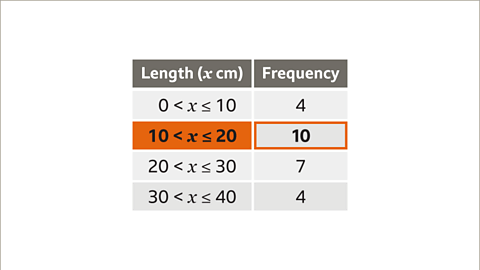
Identifying the Modal Class
- The modal class is the group containing the highest frequency of fish. By determining the group with the highest frequency, which could be, for example, 10, we identify the modal class as 10 < 𝑥 ≤ 20.

Example of a Grouped Frequency Table
Consider a table displaying the lengths of 25 fish in various groups and their corresponding frequencies. The goal is to estimate the mean length based on this information.
Practise working out averages from grouped data
Practice calculating averages from grouped data with this interactive quiz. Make sure to have a pen and paper handy for your responses.
Real-life maths

Grouped data is commonly used in medical research to analyze the effectiveness of treatments for different patient groups. Data can be grouped based on factors like age, dosage of medication, or time since infection.
Calculating an average involves deriving a single 'typical' value to represent a set of values. Healthcare researchers often use measures like mean, median, or mode to summarize data and make informed treatment recommendations.
Game - Divided Islands


