Year 11 Exam > Year 11 Notes > Mathematics for GCSE/IGCSE > Probability Tree Diagrams
Probability Tree Diagrams | Mathematics for GCSE/IGCSE - Year 11 PDF Download
Tree Diagrams
What is a tree diagram?
- A tree diagram is utilized for:
- Displaying outcomes of sequential events
- Assisting in probability calculations involving AND and OR scenarios
- Tree diagrams are predominantly employed when an event has only two significant outcomes such as:
- "Rolling a 6 on a dice"
- "Not rolling a 6 on a dice"
- These outcomes are mutually exclusive, meaning they cannot occur simultaneously.
How do I draw and label a tree diagram?
- The initial branches depict the results of the first experiment, which can be labeled as "A" and "not A".
- Two distinct sets of branches illustrate the outcomes of the second experiment:
- The first set continues from "A" in the first experiment.
- The second set continues from "not A" in the first experiment.
- The outcomes of the second experiment are broadly termed as "B" and "not B".
- Probabilities for each specific outcome are indicated along the branches of the tree diagram.
- At the conclusion of the diagram, various combinations of the two experiments are compiled, including:
- "A" and "B"
- "A and not B"
- "not A and B"
- "not A and not B"

How do I solve probability problems involving tree diagrams?
- Interpret questions in terms of AND and/or OR
- Draw, or complete a given, tree diagram
- Determine any missing probabilities
- often using 1 - P (A)
- Determine any missing probabilities
- Write down the outcomes of both events and work out their probabilities
- These are AND statements

- You may see this as “Multiply along branches”
- If more than one outcome is required then add their probabilities
- These are OR statements

- You may see this as “Add different outcomes”
- When you are confident with tree diagrams you can just pull out the outcome(s) you need
- you do not routinely have to work all of them out
How do I use tree diagrams with conditional probability?
- Conditional Probabilities in Tree Diagrams:
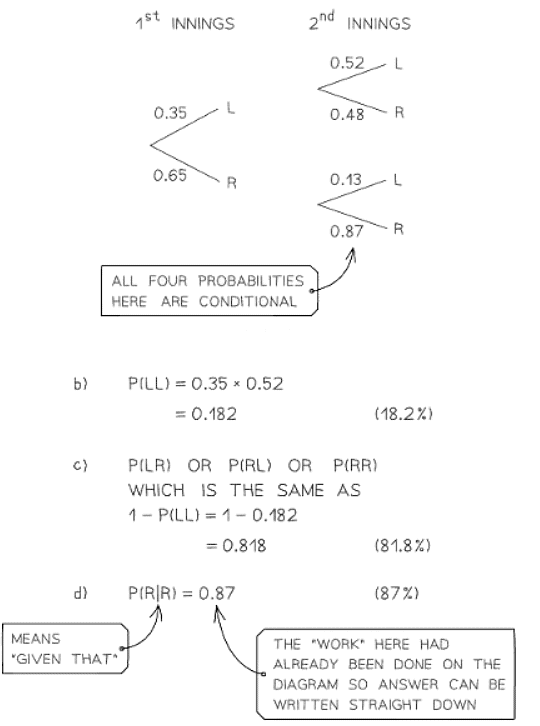
- Probabilities that depend on a prior event are called conditional probabilities.
- Example: A team's probability of winning or losing a game may change based on the outcome of their previous game.
- Identifying Conditional Probabilities in Tree Diagrams:
- Interested in the probability of winning after losing the previous game.
- This probability is found in the branches following the 'lose' outcome in the first set of branches.
- Drawing Tree Diagrams for Sequential Events:
- Example: Drawing two counters from a bag without replacement.
- Probabilities on the second set of branches depend on the outcome of the first draw.
- Adjusting Probabilities on Second Set of Branches:
- Denominators for the second set of probabilities decrease by one compared to the first set.
- Numerators also change based on the first event's outcome.
- Using Worked Examples:
- Look at worked examples to understand how conditional probabilities are calculated and represented.
- Identifying Conditional Probability Questions:
- Often introduced with "given that...".
- Example: "Find the probability that the team wins their next game given that they lost their previous game."
- Straight Bar Notation:
- Conditional probabilities are written using the 'straight bar' notation P(A∣B).
- Read as "the probability of A given B".
- Example: P(win∣lose) means the probability of winning given that they lost the previous game.
- Order of Events in Straight Bar Notation:
- The event after the straight bar occurs first.
- The event before the straight bar occurs afterward.


Combined Probability
What is Meant by Combined Probabilities?
- In general, combined probabilities involve considering more than one event.
- These events can be independent or mutually exclusive.
- They may also include events that follow on from previous events, such as rolling a dice followed by flipping a coin.
How do I work with and calculate combined probabilities?
- AND/OR Statements:
- Convert questions into probability statements using AND (for combined events) and OR (for alternative events).
- Example: "The probability of rolling a 6 followed by flipping heads" becomes "the probability of rolling a 6 AND flipping heads."
- Using AND and OR in Probability:
- AND means multiply (used for independent events).
- OR means add (used for mutually exclusive events).
- Total Probability Equals 1:
- The sum of all probabilities in a given scenario is 1.
- This is particularly useful for events happening or not happening.

- Tree Diagrams for Combined Probabilities:
- Tree diagrams help calculate combined probabilities, especially when considering two outcomes from each event.
- Example: The probability of being stopped at one set of traffic lights and also at a second set.
- Using Rules Without Diagrams:
- Unless specifically required, drawing a diagram is not necessary.
- Often quicker to consider possible outcomes and apply AND/OR rules directly without a diagram.
Question for Probability Tree DiagramsTry yourself: When are tree diagrams predominantly used?View Solution
The document Probability Tree Diagrams | Mathematics for GCSE/IGCSE - Year 11 is a part of the Year 11 Course Mathematics for GCSE/IGCSE.
All you need of Year 11 at this link: Year 11
|
84 videos|120 docs
|

|
Explore Courses for Year 11 exam
|

|
Signup for Free!
Signup to see your scores go up within 7 days! Learn & Practice with 1000+ FREE Notes, Videos & Tests.
Related Searches


