Year 4 Exam > Year 4 Notes > Mathematics > How can data be displayed?
How can data be displayed?

How can you display data?
There are lots of ways to visualise data.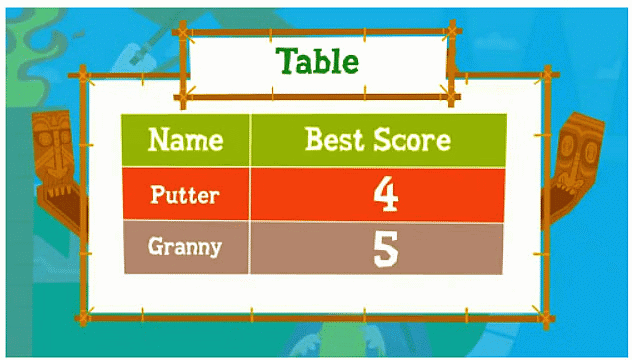
- A table is used to record various pieces of data about different items. This table displays each player's highest score.
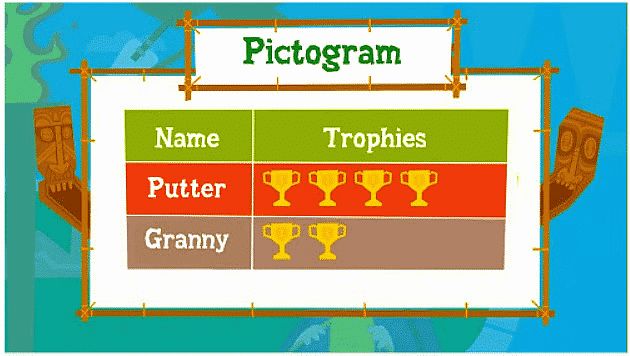
- In this pictogram, the number of wins for each player is illustrated with pictures of trophies.
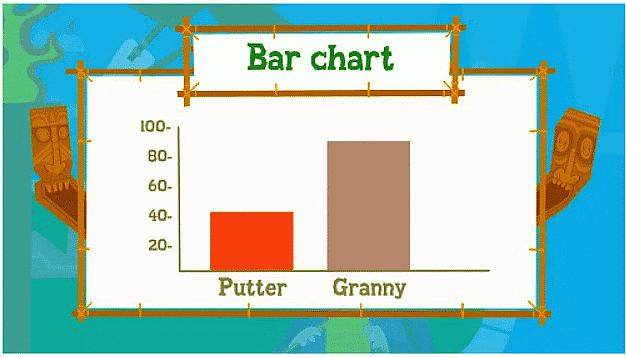
- The bar heights in this bar chart represent the ages of Putter and Granny.
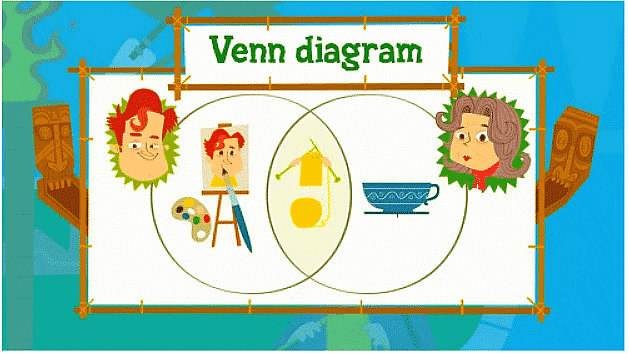
- The Venn diagram depicts the hobbies of both players. The overlapping section indicates their shared hobby - knitting!
The document How can data be displayed? is a part of the Year 4 Course Year 4 Mathematics.
All you need of Year 4 at this link: Year 4
About this Document

4.85/5 Rating

Apr 20, 2026 Last updated
Related Exams
Document Description: How can data be displayed? for Year 4 2026 is part of Year 4 Mathematics preparation. The notes and questions for How can data be displayed? have been prepared according to the Year 4 exam syllabus. Information about How can data be displayed? covers topics like and How can data be displayed? Example, for Year 4 2026 Exam. Find important definitions, questions, notes, meanings, examples, exercises and tests below for How can data be displayed?.
Introduction of How can data be displayed? in English is available as part of our Year 4 Mathematics for Year 4 & How can data be displayed? in Hindi for Year 4 Mathematics course. Download more important topics related with notes, lectures and mock test series for Year 4 Exam by signing up for free. Year 4: How can data be displayed?
Description
How can data be displayed? of Year 4 Mathematics covers all the important topics, helping you prepare for the Year 4 exam on EduRev. Start for free!
Information about How can data be displayed?
In this doc you can find the meaning of How can data be displayed? defined & explained in the simplest way possible. Besides explaining types of How can data be displayed? theory, EduRev gives you an ample number of questions to practice How can data be displayed? tests, examples and also practice Year 4 tests


Related Searches
pdf , practice quizzes, Extra Questions, mock tests for examination, Viva Questions, Previous Year Questions with Solutions, Exam, Semester Notes, video lectures, study material, shortcuts and tricks, MCQs, How can data be displayed?, Free, ppt, Sample Paper, Summary, past year papers, How can data be displayed?, Important questions, How can data be displayed?, Objective type Questions;