Statistics

Statistics is the study of collection, analysis, interpretation, presentation and organisation of data. It deals with all aspects of data, including the planning of data collection in terms of design of surveys and experiments.
Mean
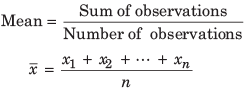
The mean of a set of data values is the sum of all data values divided by the number of data values. It is a measure of central tendency that gives a single value representing the centre of the data.
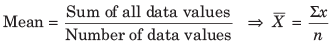
Arithmetic Mean
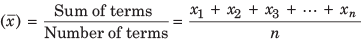
The arithmetic mean (AM) or simply the average of a set of numerical values is calculated by adding the values and dividing by the number of terms.
- For two numbers a and b, AM = (a + b)/2.
- = 0 where x is the AM (i = 1....n).

- If
 are the respective AMs of two different sets of data having a1 and a2elements respectively, then mean of the total set is
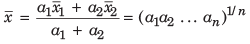
Geometric Mean
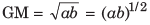
The geometric mean (GM) of n positive numbers is the nth root of their product. For two numbers a and b,
Harmonic Mean
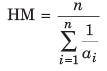
The harmonic mean (HM) is appropriate when averaging rates or ratios. The harmonic mean of the positive real numbers a1, a2, ..., an (> 0) is defined by
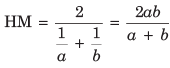
For two numbers a and b,
The standard inequality among these means is AM ≥ GM ≥ HM, with equality when all numbers are equal.
Mean of Ungrouped Data
Data given as individual observations (not gathered into class intervals) are called ungrouped data. If x1, x2, ..., xn are the observations, then the mean is
Mean of Grouped Data
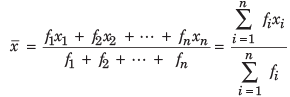
When observations are given with frequencies in classes, the mean of grouped data is computed by treating class marks (mid-points) and frequencies. If x1, x2, ..., xn are class marks with respective frequencies f1, f2, ..., fn, then
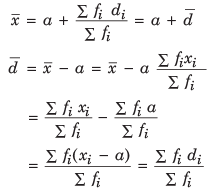
Assumed Mean Method: This is a convenient method to calculate mean when class marks are large; choose an assumed mean (A) and use deviations from A to simplify calculations.
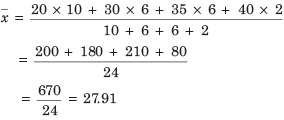
Example: The following table gives the marks scored by 24 students in a class
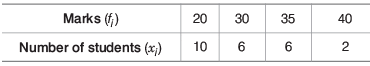
Find the mean of the data given.
(a) 26.81
(b) 27.91
(c) 28.11
(d) None of these
Ans: (b)
Median
The median of a data set is the value that divides the distribution into two equal parts when the observations are arranged in ascending or descending order.
- The median is the middle term when the number of terms is odd.
- The median is the average of the middle two terms when the number of terms is even.
- The median divides the distribution into two equal parts (each part containing half of the observations).
Median of Ungrouped Data
Step 1 Arrange the data in ascending or descending order.
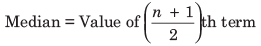
Step 2 (a) If n is odd, then
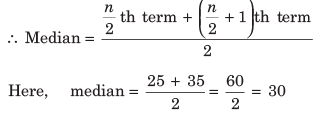
(b) If n is even, then Median
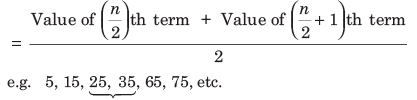
Example: Here, n = 6
Median of Grouped Data
When data are given in class intervals, find cumulative frequencies and locate the class in which n/2 falls. This class is called the median class. The median is computed by linear interpolation within the median class.
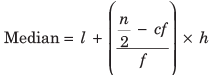
where,
- l = lower limit of the median class
- n = number of observations
- cf = cumulative frequency of the class preceding the median class
- f = frequency of the median class
- h = class size
Procedure: Find cumulative frequencies of all classes and compute n/2. Locate the class whose cumulative frequency is first greater than n/2; that is the median class.
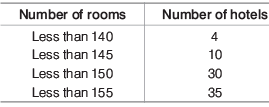
Example: The data below given shows the number of rooms in 50 hotels of a city
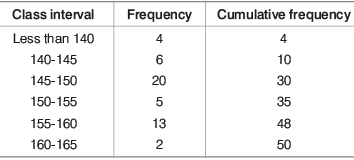
Find the median number of rooms.
(a) 148.25
(b) 148.50
(c) 148.75
(d) 149.00
Sol. (c) Here, n = 50
So, n/2 = 25
25 lies in the 145-150 class interval.
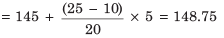
∴ The median class = 145-150,
l = 145, cf = 10, f = 20 and h = 5
Thus,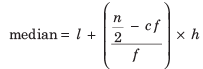
Mode
The mode is the observation (value) that occurs most frequently in the data set. It is another measure of central tendency and is useful for categorical as well as numerical data.
Mode of Ungrouped Data
Examples:
- 4, 1, 1, 4, 11, 11, 7, 5, 11, 35, 12, ... Here the mode is 11 (occurs most frequently).
- 4, 4, 1, 4, 11, 11, 7, 5, 11, 35, 12, ... This distribution may be multi-modal if more than one value shares the highest frequency.
- When two or more items have the same highest frequency, the mode is not unique (the distribution is bi-modal or multi-modal) and mode as a single value may be undefined or not useful.
Mode of Grouped Data
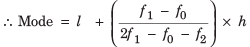
For grouped data the mode is estimated using the modal class (the class with maximum frequency) and linear interpolation:
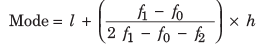
where,
- l = lower limit of the modal class
- h = size of the class interval
- f0 = frequency of the class preceding the modal class
- f1 = frequency of the modal class
- f2 = frequency of the class succeeding the modal class
Example: The table below shows the number of cars (in lakh) on road of 30 different states
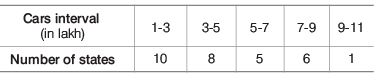
What is the mode of the data shown above?
(a) 3.66
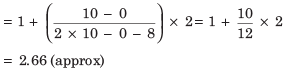
(b) 2.66
(c) 3.00
(d) None of the above
Sol. (b) Here, the modal class = 1-3 (as it has the maximum frequency i.e. 10)
l = 1, Class size (h) = 2, f1 = 10, f0 = 0, f2 = 8
Empirical Relationship between Mean, Median and Mode
For a moderately skewed distribution, the following empirical relation is often used:
Mode = 3 × Median - 2 × Mean
Here skewness refers to the degree of departure from a normal (bell-shaped) symmetrical distribution.
Example: For a given data mean is 39 and mode is 36. Find the median.
(a) 38
(b) 39
(c) 37
(d) 40
Sol. (a) Mode = 3 × Median - 2 × Mean
⇒ 36 = 3 × Median - 2 × 39
⇒ 36 = 3 × Median - 78
⇒ 36 + 78 = 3 × Median ⇒ 114/3 = Median
∴ Median = 38
Solved Example
Q1: Marks obtained by a student in 5 subjects are given below 25, 26, 27, 28, 29 in these obtained marks 27 is
(a) mode
(b) median and mode
(c) mean and median
(d) Both (a) and (c)
Ans: (c)
27 is in the middle, so is the median and it's the mean too.
Q2: The mean weekly pay for ten persons equals to ₹ 100, if one of the persons gets a hike of `₹ 10 per week, what is the new mean weekly pay?
(a) ₹ 99
(b) ₹ 101
(c) ₹ 200
(d) ₹ 250
Ans: (b)
Total weekly salary = 100 × 10 = ₹ 1000
After hike, total salary = 1000 + 10 = ₹ 1010
Now, mean weekly salary = 1010/10 = ₹101
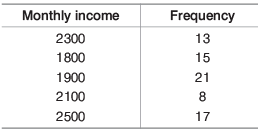
Q3: The mode for the following data will be
(a) 2300
(b) 2500
(c) 1900
(d) 2100
Ans: (c)
1900 as it has the highest frequency.
Q4: Mean of 11 observations is 17.5. If an observation 15 is deleted, then find the mean of the remaining observations.
(a) 17.5
(b) 17.25
(c) 17.75
(d) None of these
Ans: (c)
Mean of the 11 observations is 17.5.
⇒ Total of 11 observations = ΣXi = 11 × 17.5 = 192.5
One observation 15 is deleted. i.e. total of 10 observations = 192.5 - 15 = 177.5
∴ Mean of 10 observations = 177.5/10 = 17.75
Q5: The median for the data 2, 4, 6, 8, 10, 12, 14 is
(a) 6
(b) 8
(c) 9.5
(d) 10
Ans: (b)
4th observation i.e. 8 is the median.
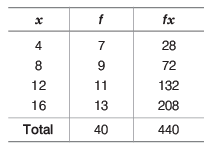
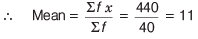
Q6: The mean of the following data is
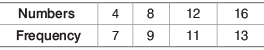
(a) 10
(b) 11
(c) 12
(d) None of these
Ans: (b)
The mean of the data given below:
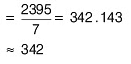
Q7: The sales in rupees of a particular soap from Sunday to Saturday are given. Find the mean of daily sales 310, 420, 380, 370, 215, 430, 270.
(a) 342
(b) 342.25
(c) 342.5
(d) None of these
Ans: (a)
Arithmetic mean,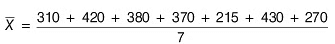
Q8: If 6, 4, 5 and 3 occur with frequencies 2, 2, 5 and 4 respectively, then the arithmetic mean is
(a) 6
(b) 4.38
(c) 6.25
(d) 5.42
Ans: (b)
Arithmetic mean, 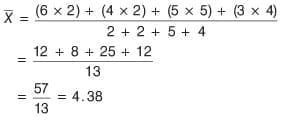
FAQs on Statistics
| 1. What is the difference between mean, median, and mode? |  |
| 2. How are mean, median, and mode used in statistics? | |
| 3. When is it appropriate to use the mean, median, or mode in data analysis? | |
| 4. How do you calculate the mean, median, and mode of a set of numbers? | |
| 5. Can a data set have more than one mode? | |


