Practice Questions : Line Graphs | BPSC Preparation: All subjects - BPSC (Bihar) PDF Download
Directions for Questions (1-6):
The graph given below shows the quantity of milk and food grains consumed annually along with female and male population (in millions). Use the data to answer the questions that follow.
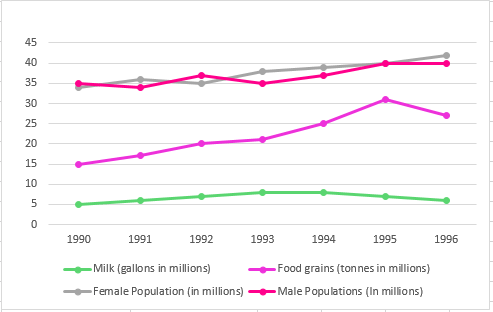 Q1:In which year was the difference between the percentage increase in the production of food grains and milk maximum?
Sol: The difference is maximum when one quantity is maximum and other quantity is minimum. The percentage increase in production of food grains is maximum in 1995 and the percentage production increase in production of milk is negative for 1995.
Q2: When was the per capita production of milk least?
Sol: The population is increasing steadily, but the milk produced decreased significantly in 1996.
Hence, the only two years we need to check for the least per capita milk production are the first year (1990) and 1996.
Milk produced in 1990 is 5 million gallons.
Total population in 1990 is 34+35 = 69 million.
Hence, per capita production of milk in 1990 is 0.072 gallon per person.
Milk produced in 1996 is 6 million gallons.
Total population in 1996 is 40+42 = 82 million.
Hence, per capita production of milk in 1996 is 0.073 gallon per person.
Hence, the year with the least per capita production of milk is 1990.
Q3: Referring to the previous question, in which year was the per capita consumption of this nutrient highest?
Sol: Ratio of nutrient in milk(1 gallon) and foodgrains(1 tonne) is 3:2
There is a huge spike in the consumption of food grains in 1995.
Total nutrients consumed in 1995 = 30*80 + 7*120 = 3240 million gms.
This is more than any other year.
=> 1995 is the answer
Q4: If milk contains 320 calories and foodgrains contain 160 calories, in which year was the per capita consumption of calories highest?
Sol: The consumption of milk is comparatively lesser than that of food grains and also the consumption of milk does not change by much during the given period.
Hence, the change in food grains is the key to estimate the calorie count.
We can see the spike in consumption of food grains in 1995. Hence, percapita consumption is highest in 1995.
Q5: When was the per capita production of foodgrains most?
Sol: In this question the total population does not change much in the whole span. So the per capita food grain production will be maximum when the total foodgrain production is maximum. It happens in 1995.
Q6: If one gallon of milk contains 120 g of a particular nutrient, and one tonne of foodgrains contains 80 g of the same nutrient, in which year was the availability of this nutrient maximum?
Sol: The maximum availability of the nutrient will be either in 1994 or 1995. because the cumulative production of milk and food grains is maximum in these years.
Availability in 1994 = (120*8) + (25*80) = 2960
Availability in 1995 = (6*120) + (31*80) = 3200Hence the availability is maximum in 1995.
Direction for Questions (7-10):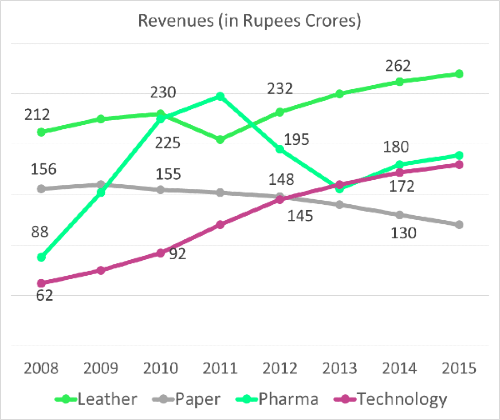
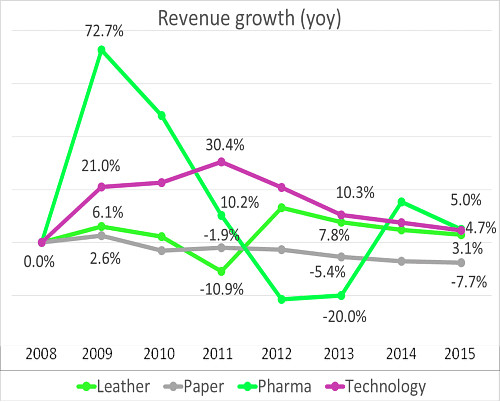
Q7: In the year 2013, what was the share of revenues of the division Pharma?
Sol: Once again, we can compute 2013 numbers using actuial 2012 numbers and 2013 growth rates by division. Share of Pharma is 22%.
The question is "In the year 2013, what was the share of revenues of the division Pharma?"
Hence, the answer is "22%".
Q8: The profit margins by division in the years 2014 and 2015 are given in the table below. Find the yoy percentage growth in profits in 2015.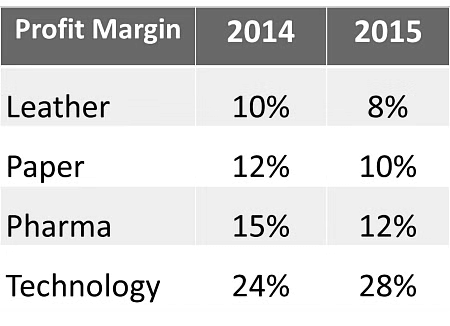
Sol:
2014 and 2015 profits by division are as follows Profits have gone from Rs. 110.1 Crores in 2014 to Rs. 106.8 Crores in 2015, a decline of 3%.
The question is "Find the yoy percentage growth in profits in 2015"
Hence, the answer is "-3%".
Q9: Which year saw the highest percentage growth in revenues overall?
Ans: 2009
Sol:
For this we need to fill in the grid completely and then find overall revenues. Thankfully, we have already computed for 2 different years. (For previous questions). We need to compute only for 2009 and 2015. With this, we can complete the overall grid. The overall grid should make the last question also simpler.
 The maximum year on year growth rate was seen in 2009.
We could have obtained this by scanning at the growth rate graph as well. The Pharma number is off the charts and all 4 growth rates are positive. The 21% growth rate in Technology is also pretty high. So, here was an easy question that we have gone about in a roundabout fashion.
The question is "Which year saw the highest percentage growth in revenues overall?"
Hence, the answer is "2009".
2009 is the correct answer.
Q10: What was the total revenues in 2011?
Sol: We know 2010 revenues by division and 2011 growth rates by division. We just need to put these two together.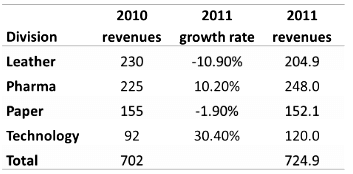 2011 revenues were Rs. 725 Crores.
The question is "What was the total revenues in 2011?"
Hence, the answer is "Rs. 725 Crores".
|
39 videos|82 docs|41 tests
|
FAQs on Practice Questions : Line Graphs - BPSC Preparation: All subjects - BPSC (Bihar)
| 1. What are the most common hobbies represented in line graphs? |  |
| 2. How can I create a line graph to represent my hobbies? |  |
| 3. What insights can be gained from analyzing line graphs of hobbies? |  |
| 4. How do line graphs differ from other types of graphs in representing hobbies? |  |
| 5. What are some tips for interpreting line graphs related to hobbies? |  |

|
Explore Courses for BPSC (Bihar) exam
|

|


