Index Numbers Chapter Notes | Quantitative Aptitude for CA Foundation PDF Download
Chapter Overview
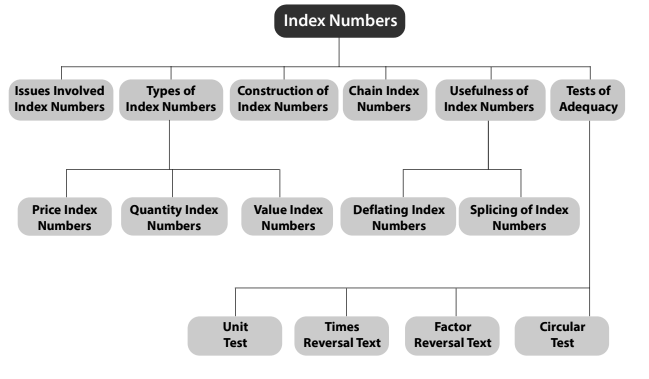
Introduction
Index numbers are useful tools for measuring how things change over time or between different places. They are similar to how we use the arithmetic mean to represent a set of values, but index numbers help us compare values from different periods or locations. The main idea behind creating index numbers is to average the relative changes in quantities or prices because relatives can be compared and added, even if the original data cannot. For instance, if wheat production increases to 110% of last year's production and cotton production rises to 105%, we can average these two percentages to show an overall increase of 107.5%. This is based on the assumption that both have equal importance. However, if wheat is twice as important as cotton, we should weight the percentages accordingly, giving wheat a weight of 2 and cotton a weight of 1. The average relatives obtained through this process are called index numbers.
Definition: An index number is a ratio that compares two or more time periods, with one of them being the base period. The value from the base period serves as the standard for comparison.
Example: Index numbers are used in various contexts such as the National Stock Exchange (NSE), Bombay Stock Exchange (BSE), Wholesale Price Index (WPI), and Consumer Price Index (CPI).
- An index time series consists of a list of index numbers for different time periods, all using the same base year for comparison.
- Relatives are important because absolute numbers alone may not convey meaningful information. If the meaning of a relative figure is unclear, it is necessary to consider both the absolute and relative numbers for context.
Our focus is on various types of index numbers, their applications, mathematical tests, and the principles involved in their construction. Index numbers are relevant because they are used in techniques for making forecasts or inferences, such as regression analysis. In this context, either the independent or dependent variable, or both, may be expressed as index numbers. Index numbers are more manageable than large figures and are easier to understand.
There are two main types of index numbers: simple and composite. A simple index is calculated for a single variable, while a composite index is derived from two or more variables. Most index numbers are composite in nature.
Issues Involved
- Selection of Data: It's crucial to know the purpose of the index. For example, if the index is meant to track the cost of living, there's no need to include the prices of capital goods that don't directly affect living costs.
- Representative Sampling: Index numbers are often based on samples, so it's important to ensure that these samples accurately represent the larger population. Using random sampling or even stratified random sampling can help achieve this.
- Data Comparability: To ensure that the data used is comparable, the method for selecting the items for the index must be consistent throughout the process.
- Commodity Selection Challenges: Choosing which commodities to include can be difficult because the importance of different goods changes as society evolves. Over time, these changes can be significant in terms of what is produced and how people use these products.
- Base Period: The base period must be chosen carefully as it serves as a reference point for comparing data. This period should be stable and not influenced by extraordinary events such as wars or famines. It should also be relatively recent, focusing on current changes rather than distant past events. There are three types of base periods: fixed, chain, and average.
- Weight Selection: It's important that each variable in a composite index has an appropriate influence on the overall index. This means that the relative importance of each variable should be considered based on the index's intended use. For instance, in a cost of living index, sugar should not be weighted the same as cereals.
- Use of Averages: To create a single index number that summarizes a lot of information, averages are essential. The geometric mean is better for averaging relative changes, but the arithmetic mean is commonly used for its simplicity.
- Choice of Variables: Index numbers can focus on price, quantity, or other measures. It’s necessary to determine the unit of measurement. For price index numbers, one must decide whether to use wholesale or retail prices, which depends on the index's purpose. Additionally, the time frame for these prices needs to be established, often preferring an average price over a specific time period rather than just the end price.
- Formula Selection: Choosing the right formula is crucial because different types of indices can yield different results when applied to the same data. It is important to understand the various types of indices available for construction.
Construction of Index Number
Notations- It is common to use P n(1), P n(2), and P n(3) to represent the prices of the first, second, and third goods during the nth time period.
- The prices during a reference period are shown as P o(1), P o(2), P o(3), and so on.
- The price of the jth commodity at time n can be written as P n(j).
- We can express the total price using summation notation, which adds up the values represented by the superscript j.

We can omit the superscript altogether and write as ∑Pn etc.
Relatives: A basic example of an index number is a price relative, which compares the price of a single item during one time period to its price during another time period, known as the base period or reference period.
The formula for the price relativeis:
Price relative = Pn / Po
To express this as a percentage, you need to multiply by 100:
Price relative = Pn / Po x 100
There are also other types of relatives, such as those for quantities, volume of consumption, exports, and more. For these, the quantity relativecan be represented as:
Quantity relative = Qn / Qo
Similarly, there are value relatives:

When successive prices or quantities are taken, the relatives are called the link relative, When the above relatives are in respect to a fixed base period these are also called the chain relatives with respect to this base or the relatives chained to the fixed base. They are in the form of :
 Methods: We can state the broad heads as follows:

Simple Aggregative Method
In this method of computing a price index, we express the total of commodity prices in a given year as a percentage of total commodity price in the base year. In symbols, we have where ∑Pn is the sum of all commodity prices in the current year and ∑Po is the sum of all commodity prices in the base year.
ILLUSTRATIONS:

Simple Aggregative Index for 1999 over 1998 = 
and for 2000 over 1998 = 
The described method is straightforward but has a significant flaw: it implies that the first commodity has a greater influence due to its higher price compared to the other two commodities. Additionally, changing the units will alter the index numbers. Students are encouraged to independently calculate the index number using the prices of eggs per dozen for three years: ₹36, ₹43.20, and ₹39.60. This highlights the major issue of relying on absolute quantities instead of relative ones, as such price quotes serve as concealed weights without logical significance.
Simple Average of Relatives
To address the limitations of a basic aggregative index, a simple average of relatives can be used. This involves converting actual prices for each variable into percentages based on a base period, referred to as relatives since they relate to the base period's value. The index number is then derived as the average of these relatives. A significant benefit of using price relatives is that they are dimensionless, ensuring that the price index remains consistent regardless of the units used for pricing. This approach satisfies the unit test criterion and allows for the construction of quantity indices for variables measured in different units.ILLUSTRATIONS:
In the proceeding example we will calculate relatives as follows:

Despite some improvements, the current method has a flaw in that it assigns equal importance to all relatives, which leads to disproportionately high weight being given to commodities used in small quantities. This occurs because relatives that do not consider the absolute quantity tend to assign more weight than warranted based on the actual usage. This issue can be addressed by implementing a suitable weighing system.
Weighted Method
To meet the weakness of the simple or unweighted methods, we weigh the price of each commodity by a suitable factor often taken as the quantity or the volume of the commodity sold during the base year or some typical year. These indices can be classfied into broad groups:(i) Weighted Aggregative Index.
(ii) Weighted Average of Relatives.
(i) Weighted Aggregative Index: Under this method we weigh the price of each commodity by a suitable factor often taken as the quantity or value weight sold during the base year or the given year or an average of some years. The choice of one or the other will depend on the importance we want to give to a period besides the quantity used. The indices are usually calculated in percentages. The various alternatives formulae in use are:
(The example has been given after the tests).
(a) Laspeyres’ Index: In this Index base year quantities are used as weights:

(b) Paasche’s Index: In this Index current year quantities are used as weights:

(c) Methods based on some typical Period:
Index  the subscript t stands for some typical period of years, the quantities of which are used as weight
Note: * Indices are usually calculated as percentages using the given formulae
The Marshall-Edgeworth index uses this method by taking the average of the base year and the current year

(d) Fisher’s ideal Price Index: This index is the geometric mean of Laspeyres’ and Paasche’s.

(ii) Weighted Average of Relative Method: To overcome the disadvantage of a simple average of relative method, we can use weighted average of relative method. Generally weighted arithmetic mean is used although the weighted geometric mean can also be used. The weighted arithmetic mean of price relatives using base year value weights is represented by
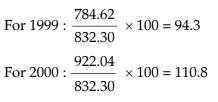
 Example:
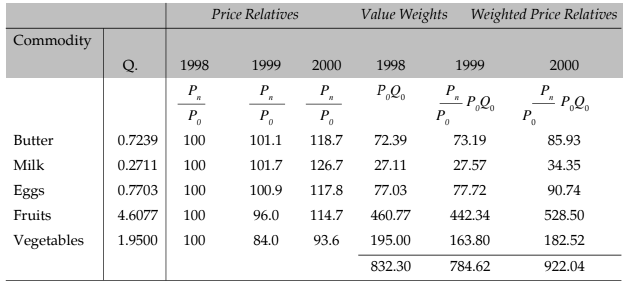
Weighted Price Relative
The Chain Index Numbers
Previous analyses focused on a fixed base, which is inadequate for rapidly changing conditions. Instead, a variable base approach, where each year is compared to the preceding one (e.g., using 1998 for 1999 and 1999 for 2000), may be more effective. If there's a need to connect these relative indices to a common base, they can be linked together. This method involves calculating the relatives for each year in relation to the previous year, known as link relatives, and then multiplying these link relatives successively to create a chain index.
The formula is:
Chain Index = Link relative of current year Chain Index of the previous year / 100
Example:
The following are the index numbers by a chain base method:
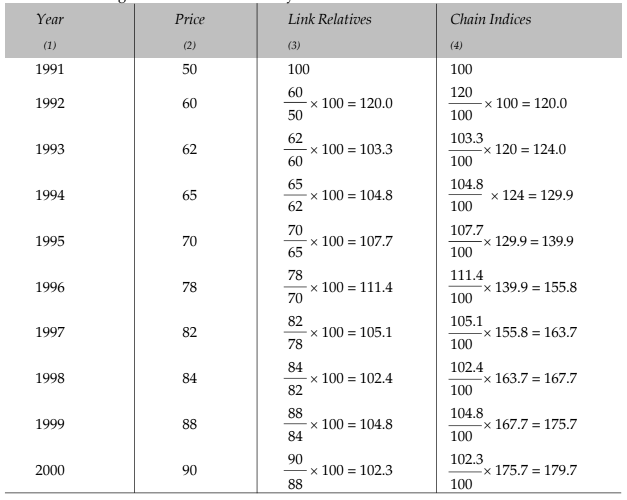
Link relatives show annual changes compared to the previous year, while chained indices use a fixed base year, such as 1991 in this case. Chained indices can complicate analysis unless complete data for the entire period is unavailable or when there are changes in the commodity basket or weights. The link relatives for the current year and the chain index based on a specific base year will also yield a fixed base index for that designated year.
Quantity Index Number
Price index numbers are used to measure and compare prices, while Quantity Index Numbers are utilized for measuring and comparing quantities. Price indices serve as indicators of economic strength, whereas Quantity indices reflect the level of output in the economy. To create Quantity indices, we assess changes in quantities and apply prices or values as weights for measurement.
The various types of Quantity indices are:
1. Simple aggregate of quantities:
This has the formula 
2. The simple average of quantity relatives:
This can be expressed by the formula 
3. Weighted aggregate Quantity indices:
(i) With base year weight :  (Laspeyre’s index)
(ii) With current year weight :  (Paasche’s index)
(iii) Geometric mean of (i) and (ii) :  (Fisher’s Ideal)
4. Base-year weighted average of quantity relatives. This has the formula
 Note : Indices are usually calculated as percentages using the given formulae.
Value Indices
Value equals price multiplied by quantity. Thus a value index equals the total sum of the values of a given year divided by the sum of the values of the base year, i.e.,
Limitations of Index Numbers
- The construction of index numbers often relies on specific samples, which means that errors can occur.
- Index numbers are based on chosen items, so they show general trends rather than the complete picture.
- Different methods are used to create index numbers, leading to varying results that can cause confusion.
Uses of Index Numbers
- They help in creating appropriate policies in economics and business, guiding decisions in areas like intelligence measurements and research.
- Index numbers show trends and patterns, aiding in drawing important conclusions about cyclical and irregular forces.
- They are essential for forecasting future economic activities, particularly in analyzing long-term trends, seasonal changes, and cyclical movements.
- Index numbers are valuable for deflating, which means adjusting original data for price changes, converting nominal wages into real wages.
- The cost of living index numbers track changes in the cost of living over specific periods.
Deflating Time Series using Index Numbres
A price index is often utilized to assess real values in economic time series data expressed in monetary terms. For instance, Gross National Product (GNP) is initially calculated at current prices to capture the impact of price fluctuations over time. To analyze the growth of physical goods and services over time, the influence of price changes on GNP values is removed. Consequently, real economic growth, adjusted for constant prices from a base year, is determined by deflating GNP figures using the price index.

The formula for conversion can be stated as Deflated Value = Current Value Price Index of the current year


Shifting and Splicing of Inex Numbers
These refer to two technical points: (i) how the base period of the index may be shifted, (ii) how two index covering different bases may be combined into single series by splicing.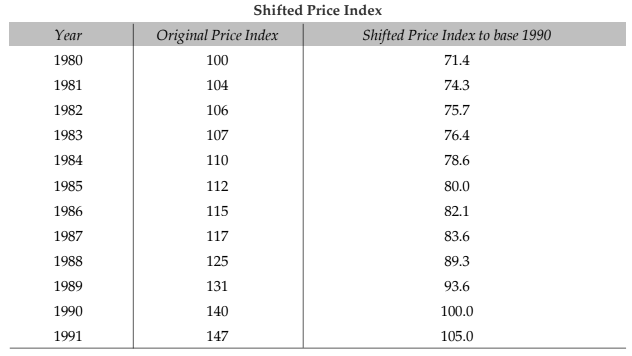
The formula used is,
 Splicing two sets of price index numbers covering different periods of time is usually required when there is a major change in quantity weights. It may also be necessary on account of a new method of calculation or the inclusion of new commodity in the index.
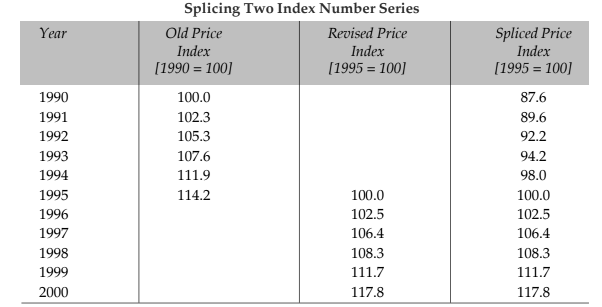
You will notice that the old series upto 1994 has to be converted shifting to the base. 1995 i.e, 114.2 to have a continuous series, even when the two parts have different weights
Test of Adequacy
There are four tests:
(i) Unit Test: This test requires that the formula should be independent of the unit in which or for which prices and quantities are quoted. Except for the simple (unweighted) aggregative index all other formulae satisfy this test.
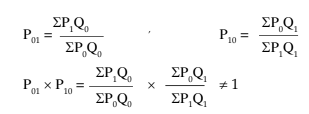
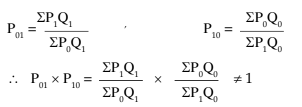
(ii) Time Reversal Test: It is a test to determine whether a given method will work both ways in time, forward and backward. The test provides that the formula for calculating the index number should be such that two ratios, the current on the base and the base on the current should multiply into unity. In other words, the two indices should be reciprocals of each other. Symbolically,
P01 x P10 = 1
where P01 is the index for time 1 on 0 and P10 is the index for time 0 on 1.
You will notice that Laspeyres’ method and Paasche’s method do not satisfy this test, but Fisher’s Ideal Formula does.
While selecting an appropriate index formula, the Time Reversal Test and the Factor Reversal test are considered necessary in testing the consistency.
Laspeyres:
Paasche’s
Fisher’s:

(iii) Factor Reversal Test: This holds when the product of price index and the quantity index P1Q1 should be equal to the corresponding value index, i.e., 
Symbolically: P01 x Q01 =V01
Fishers’


Thus Fisher’s Index satisfies Factor Reversal test. Because Fisher’s Index number satisfies both the tests in (ii) and (iii), it is called an Ideal Index Number.
(iv) Circular Test: It is concerned with the measurement of price changes over a period of years, when it is desirable to shift the base. For example, if the 1970 index with base 1965 is 200 and 1965 index with base 1960 is 150, the index 1970 on base 1960 will be 300. This property therefore enables us to adjust the index values from period to period without referring each time to the original base. The test of this shiftability of base is called the circular test.
This test is not met by Laspeyres, or Paasche’s or the Fisher’s ideal index. The simple geometric mean of price relatives and the weighted aggregative with fixed weights meet this test.
Example: Compute Fisher’s Ideal Index from the following data:

Show how it satisfies the time and factor reversal tests.
Solution:
Fisher’s Ideal Index:
= √1.375 x 100 = 1.172 x 100 = 117.3
Time Reversal Test:
∴ Time Reversal Test is satisfied.
Factor Reversal Test:
Since,
is also equal to 59 / 52, the Factor Reversal Test is satisfied.
|
114 videos|164 docs|98 tests
|
FAQs on Index Numbers Chapter Notes - Quantitative Aptitude for CA Foundation
| 1. What is an index number and why is it important in economic analysis? |  |
| 2. What are the different methods for constructing index numbers? |  |
| 3. How does the Simple Aggregative Method work in constructing index numbers? |  |
| 4. What is the significance of using a Weighted Method for index numbers? |  |
| 5. Can you explain the Simple Average of Relatives method for index numbers? |  |
|
114 videos|164 docs|98 tests
|

|
Explore Courses for CA Foundation exam
|

|


 is also equal to 59 / 52, the Factor Reversal Test is satisfied.


