Grade 10 Exam > Grade 10 Notes > AP Statistics > Chapter Notes: Statistics for Two Categorical Variables
Chapter Notes: Statistics for Two Categorical Variables

Understanding Two-Way Tables
Building on the two-way table concepts from Unit 2.2, we dive deeper into analyzing relationships between two categorical variables. Beyond joint relative frequencies, two-way tables allow us to calculate marginal and conditional relative frequencies to uncover patterns and associations.
Marginal Relative Frequency
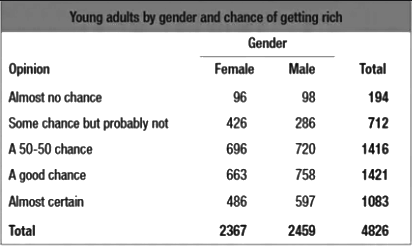
A marginal relative frequency represents the proportion of respondents in a specific category relative to the total sample. For instance, if 1,416 out of 4,826 respondents believe there's a "50-50 chance" for an event, the marginal relative frequency is calculated as 1,416 ÷ 4,826. These frequencies are derived from the row or column totals in a two-way table, divided by the overall total.
Conditional Relative Frequency
A conditional relative frequency measures the proportion of a category within a specific subgroup, where one category (the "given" or independent category) is known. For example, if 720 out of 2,459 male respondents said "50-50 chance," the conditional relative frequency for "50-50 chance given male" is 720 ÷ 2,459. Here, the denominator is the total for the subgroup (males), which is typically smaller than the overall total.
Identifying Associations in Two-Way Tables
Two-way tables help determine whether two categorical variables are associated. To assess this, compare conditional relative frequencies across categories. If the conditional relative frequencies differ significantly or deviate from the marginal relative frequency of the dependent category, an association may exist. This suggests that certain values of the independent category predict specific outcomes in the dependent category.
Example: In a two-way table, the variables "gender" and "opinion" are independent if the marginal relative frequency of "50-50 chance" (overall) is approximately equal to the conditional relative frequency of "50-50 chance given male." If these values are similar, no significant association exists between gender and opinion.
(1416/4826) = (720/2459)
0.293 = 0.293
MULTIPLE CHOICE QUESTIONTry yourself: What does a marginal relative frequency represent?
Vocabulary Practice: Units 2.1-2.3
Test your understanding by matching each term to its description:
- Two-way tables
- Side-by-side bar graphs
- Mosaic plots
- Segmented bar graphs
- Categorical variable
- Quantitative variable
- Bivariate variable
- Marginal relative frequency
- Conditional relative frequency
Descriptions:
- A visual representation dividing a rectangle into tiles to show the relationship between two categorical variables.
- A graph displaying the frequency or relative frequency of a categorical variable's categories as bars.
- A graph where bars are divided into segments to represent categories of one variable, showing relationships between two categorical variables.
- A table cross-tabulating two categorical variables, with rows for one variable and columns for the other, showing frequencies or relative frequencies.
- A variable with distinct categories (e.g., "male" or "female") that cannot be ordered or measured continuously.
- A variable measured on a continuous scale (e.g., height or weight), allowing mathematical operations.
- The proportion of one category within another, calculated by dividing the frequency of the first category within the second by the second category's total.
- The proportion of a category relative to the entire sample, calculated by dividing the category's frequency by the total sample frequency.
- A concept describing the relationship between two variables, often used to analyze associations between categorical variables.
Answers: 1-D, 2-B, 3-A, 4-C, 5-E, 6-F, 7-I, 8-H, 9-G
Key Terms to Understand
- Bivariate Variable: Involves analyzing two variables together to explore their relationship, revealing patterns or dependencies critical for data-driven decisions.
- Categorical Variable: A variable that groups data into qualitative categories, essential for comparing and analyzing relationships between groups.
- Dependent Category: A category in one variable influenced by another variable, indicating a relationship where one variable's distribution depends on another.
- Independent Category: A category unaffected by another variable, useful for assessing whether associations between variables are significant or due to chance.
- Quantitative Variable: A numerical variable that can be measured or counted, enabling calculations like averages. It includes discrete (distinct values) and continuous (any value in a range) types.
- Two-Way Table: A tool displaying frequencies or proportions of two categorical variables, facilitating analysis of their interactions and relationships.
The document Chapter Notes: Statistics for Two Categorical Variables is a part of the Grade 10 Course AP Statistics.
All you need of Grade 10 at this link: Grade 10
FAQs on Chapter Notes: Statistics for Two Categorical Variables
| 1. What is a two-way table in statistics? |  |
Ans. A two-way table, also known as a contingency table, is a data display format that summarizes the relationship between two categorical variables. It shows the frequency distribution of variables in a matrix format, where each cell represents the count of occurrences for a specific combination of categories.
| 2. How do I create a two-way table from a dataset? | |
Ans. To create a two-way table, first identify the two categorical variables you want to analyze. Next, count the occurrences of each combination of categories for those variables. Organize this data into a matrix format, with one variable represented in the rows and the other in the columns, filling in the cells with the corresponding counts.
| 3. What insights can I gain from analyzing a two-way table? | |
Ans. Analyzing a two-way table can provide insights into the relationship and association between the two categorical variables. It can help identify patterns, trends, or dependencies, such as whether one variable influences the other, and can be used to calculate probabilities, percentages, and statistical tests like the Chi-square test for independence.
| 4. How can I interpret the data presented in a two-way table? | |
Ans. To interpret data in a two-way table, look at the counts in each cell to understand the frequency of occurrences for each combination of categories. You can also calculate row or column totals to see overall distributions. Additionally, calculating relative frequencies or percentages can provide a clearer picture of the relationships between the variables.
| 5. What are some common mistakes to avoid when working with two-way tables? | |
Ans. Common mistakes include mislabeling rows and columns, failing to include totals, and not ensuring that the data is complete or accurate. Additionally, avoid jumping to conclusions without analyzing the data properly, as correlation does not imply causation. Always check for potential confounding variables that may affect the results.
About this Document

4.67/5 Rating

Apr 18, 2026 Last updated
Related Exams
Document Description: Chapter Notes: Statistics for Two Categorical Variables for Grade 10 2026 is part of AP Statistics preparation. The notes and questions for Chapter Notes: Statistics for Two Categorical Variables have been prepared according to the Grade 10 exam syllabus. Information about Chapter Notes: Statistics for Two Categorical Variables covers topics like and Chapter Notes: Statistics for Two Categorical Variables Example, for Grade 10 2026 Exam. Find important definitions, questions, notes, meanings, examples, exercises and tests below for Chapter Notes: Statistics for Two Categorical Variables.
Introduction of Chapter Notes: Statistics for Two Categorical Variables in English is available as part of our AP Statistics for Grade 10 & Chapter Notes: Statistics for Two Categorical Variables in Hindi for AP Statistics course. Download more important topics related with notes, lectures and mock test series for Grade 10 Exam by signing up for free. Grade 10: Chapter Notes: Statistics for Two Categorical Variables
Description
Chapter Notes: Statistics for Two Categorical Variables of AP Statistics with clear explanations of key concepts & important topics of the chapter, to help you underst& lessons better & revise quickly, & crack the Grade 10 exam.
Information about Chapter Notes: Statistics for Two Categorical Variables
In this doc you can find the meaning of Chapter Notes: Statistics for Two Categorical Variables defined & explained in the simplest way possible. Besides explaining types of Chapter Notes: Statistics for Two Categorical Variables theory, EduRev gives you an ample number of questions to practice Chapter Notes: Statistics for Two Categorical Variables tests, examples and also practice Grade 10 tests


Related Searches
past year papers, Viva Questions, Exam, mock tests for examination, MCQs, Extra Questions, pdf , study material, Chapter Notes: Statistics for Two Categorical Variables, shortcuts and tricks, ppt, Chapter Notes: Statistics for Two Categorical Variables, video lectures, Important questions, Objective type Questions, Sample Paper, Chapter Notes: Statistics for Two Categorical Variables, Free, Previous Year Questions with Solutions, practice quizzes, Summary, Semester Notes;