Chapter Notes: Sampling Distributions for Sample Proportions

Formulas
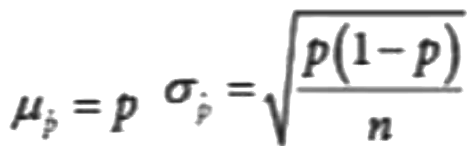
You can usually tell if you will solve a problem using sample proportions if the problem gives you a probability or percentage. For a sample proportion with probability p, the mean of our sampling distribution is equal to the probability. All formulas in this section can be found on page 2 of the given formula sheet.
Large Counts Condition
Before you can use a sampling distribution for sample proportions to make inferences about a population proportion, you need to check that the sample meets certain conditions. One of these conditions is the large counts condition, which states that the sample size should be large enough for the distribution of the sample proportion to be approximately normal.
The large counts condition can be expressed as:
- np ≥ 10
- n(1-p) ≥ 10
where n is the sample size and p is the sample proportion. This means that both the number of successes (np) and the number of failures (n(1-p)) in the sample should be at least 10. If these conditions are met, then you can assume that the sampling distribution for the sample proportion is approximately normal, and you can use statistical techniques that rely on normality, such as confidence intervals or hypothesis tests (we'll cover this in future sections!). ✅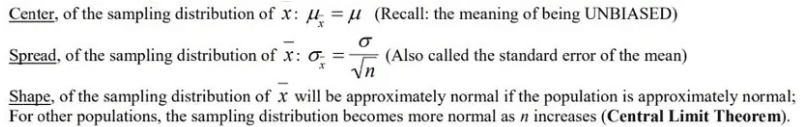
For the shape (normal) of distributions of means, you can check the Central Limit Theorem, but for proportions, you must always check the Large Counts Condition.
Practice Problem
Suppose that you are conducting a survey to estimate the proportion of people in your town who support a new public transportation system. You decide to use a simple random sample of 1000 people, and you ask them whether or not they support the new system. After collecting the data, you find that 600 people out of the 1000 respondents support the system.
(a) Calculate the sample proportion of respondents who support the new system.
(b) Explain what the sampling distribution for the sample proportion represents and why it is useful in this situation.
(c) Suppose that the true population proportion of people who support the new system is actually 0.6. Describe the shape, center, and spread of the sampling distribution for the sample proportion in this case.
(d) Explain why the Central Limit Theorem applies to the sampling distribution for the sample proportion in this situation.
(e) Calculate a 95% confidence interval for the population proportion of people who support the new system based on the sample data. (Optional for now, but feel free to answer if you already checked out the section on confidence intervals!)
(f) Discuss one potential source of bias that could affect the results of this study, and explain how it could influence the estimate of the population proportion.
Answers:
(a) The sample proportion of respondents who support the new system is 600/1000 = 0.6.
(b) The sampling distribution for the sample proportion represents the distribution of possible values for the sample proportion if the study were repeated many times. It is useful in this situation because it allows us to make inferences about the population proportion based on the sample data.
(c) If the true population proportion of people who support the new system is 0.6, the sampling distribution for the sample proportion would be approximately normal with a center at 0.6 and a spread that depends on the sample size and the variability of the population.
(d) The Central Limit Theorem applies to the sampling distribution for the sample proportion in this situation because the sample size (n = 1000) is large enough for the distribution to be approximately normal, even if the population is not normally distributed.
(e) A 95% confidence interval for the population proportion of people who support the new system can be calculated as 0.6 ± (1.96 * sqrt((0.6(1-0.6))/1000)). This gives a confidence interval of (0.570, 0.630).*
(f) One potential source of bias in this study could be nonresponse bias, which occurs when certain groups of individuals are more or less likely to respond to the survey. For example, if people who support the new system are more likely to respond to the survey, the sample could be biased toward higher levels of support and produce an overestimate of the population proportion. Conversely, if people who do not support the new system are more likely to respond, the sample could be biased toward lower levels of support and produce an underestimate of the population proportion.
Key Terms to Review
- Bias: Bias refers to a systematic error that leads to an incorrect or misleading representation of a population or phenomenon.
- Central Limit Theorem: The Central Limit Theorem (CLT) states that the sampling distribution of the sample mean approaches a normal distribution as the sample size increases, regardless of the population's distribution.
- Confidence Intervals: A confidence interval is a range of values used to estimate a population parameter and indicates the level of uncertainty associated with that estimate.
- Hypothesis Tests: Hypothesis tests are statistical methods used to determine if there is enough evidence in a sample to support a particular claim about a population parameter.
- Large Counts Condition: The Large Counts Condition states that for the sampling distribution of sample proportions to be approximately normal, the counts of successes and failures must both be large enough.
- Mean: The mean is a measure of central tendency that represents the average value of a set of numbers.
- N(1-p) ≥ 10: This condition is used to determine if the sample size is sufficient for the sampling distribution of the sample proportion to be approximately normal.
- Normal Distribution: A normal distribution is characterized by a symmetric, bell-shaped curve.
- Nonresponse Bias: Nonresponse bias occurs when selected individuals do not respond, leading to potential inaccuracies in the data collected.
- Np ≥ 10: This is a rule of thumb to determine if the sampling distribution of a sample proportion can be approximated by a normal distribution.
- Sample Proportions: Sample proportions are the ratios of a certain characteristic within a sample, expressed as a fraction of the total sample size.
- Simple Random Sample: A simple random sample is a selection of individuals from a larger population, ensuring each individual has an equal chance of being chosen.
FAQs on Chapter Notes: Sampling Distributions for Sample Proportions
| 1. What is the large counts condition in sampling distributions for sample proportions? |  |
| 2. How do you calculate the sample proportion? | |
| 3. Why is the sampling distribution of the sample proportion useful? | |
| 4. How does the Central Limit Theorem apply to sample proportions? | |
| 5. What is one source of bias that can affect survey results? | |


