Chapter Notes: Data Through Pictures

What is Data?
We collect data every day without even realising it. For example:
- Counting how many students in your class drink milk every morning
- Noting how many birds visit your garden each day
- Recording how many books each friend read this month
Raw data - like a list of numbers in a notebook - is hard to make sense of at a glance. So we organise it into a table, a pictograph, or a bar graph to make it easy to read and compare.
Pictograph
Pictographs are easy to read because pictures catch the eye quickly. You can tell which row has more or fewer items just by looking at the number of icons - without reading any numbers.
1. The Scale
Imagine you want to show that a library has 200 books. Drawing 200 tiny book pictures would be impossible! So instead, we decide that one picture = 10 books. Now we only need 20 pictures. This fixed value - what one icon stands for - is called the scale.Example: If the scale is "1 star = 4 students", then 3 stars = 12 students.
Without knowing the scale, you cannot find the actual value. Always read the scale first before reading any pictograph.
Example - Fruits Sold at a Market Stall
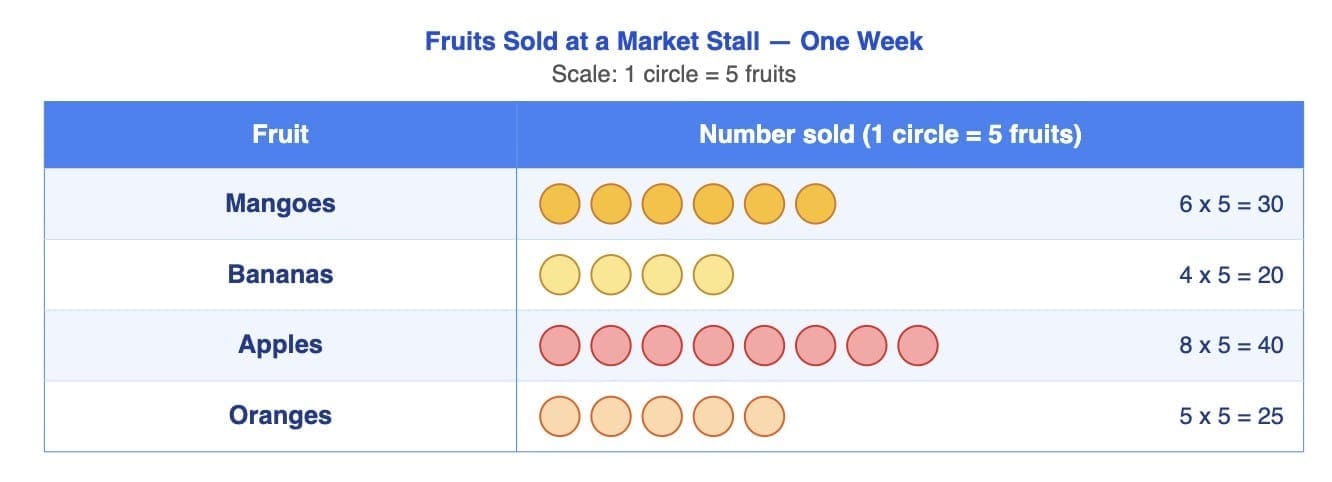
Below is a pictograph showing the number of fruits sold in one week. The scale is: 1 circle = 5 fruits.
Count the circles in each row and multiply by 5 to find the actual number of fruits sold.
From this pictograph we can quickly say:
- Apples were sold the most - 40 fruits
- Bananas were sold the least - 20 fruits
- Mangoes and Oranges together: 30 + 25 = 55 fruits
- How many more apples than bananas: 40 - 20 = 20 more
2. Half Icons in a Pictograph
When a count is not a perfect multiple of the scale, a half icon is used.Half icon = half the scale value
Example: Scale = 1 icon = 6 pencils. A row has 3 full icons + 1 half icon.
3 x 6 = 18, half icon = 3 → Total = 21 pencils
3. How to Read a Pictograph
- Read the scale first - what does 1 icon represent?
- Count the icons in each row. Count a half icon as 0.5.
- Multiply: number of icons × scale value = actual count
- To compare: see which row has more icons.
- To find the difference: subtract the smaller count from the larger.
Bar Graph
Bar Graph is a way of showing data using rectangular bars. The taller the bar, the larger the value. The shorter the bar, the smaller the value.A bar graph is ideal when you want to compare several categories at once. You can instantly see which category is the highest or lowest just by looking at bar heights.
1. Parts of a Bar Graph
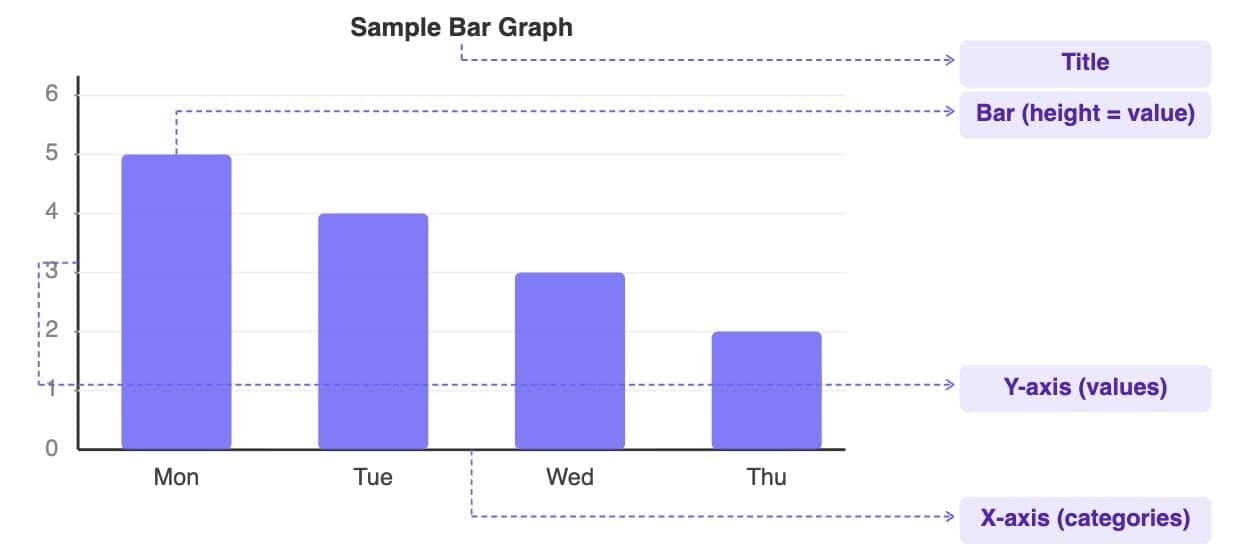
The four key parts of a bar graph - always look for all four when reading one.
| Part | What It Shows | Example |
|---|---|---|
| Title | What the graph is about | "Books read per month" |
| X-axis (horizontal →) | The categories being compared | January, February, March... |
| Y-axis (vertical ↑) | The numbers / values | 0, 2, 4, 6, 8... |
| Bars | Height of bar = value for that category | A bar reaching 6 means 6 books |
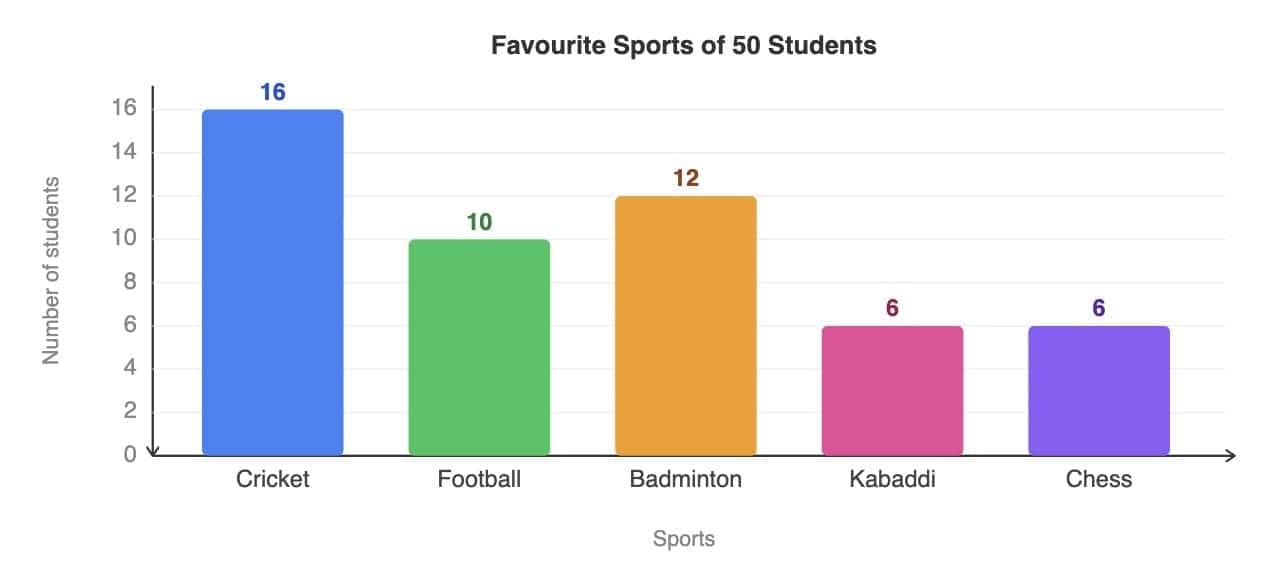
Example - Students' Favourite Sports
Bar graph showing favourite sports. Each bar's height tells you the number of students who chose that sport.
From this bar graph we can say:
- Most popular sport: Cricket - tallest bar (16 students)
- Least popular sports: Kabaddi and Chess - shortest bars (6 students each)
- How many more prefer Cricket over Football: 16 - 10 = 6 students
- Total students: 16 + 10 + 12 + 6 + 6 = 50 students
3. How to Read a Bar Graph
- Read the title to know what the graph is about.
- Look at the x-axis to see the categories.
- Look at the y-axis to understand the number scale.
- Find the value of each bar by checking where its top reaches on the y-axis.
- Tallest bar = highest value. Shortest bar = lowest value.
- To find how many more: subtract the two values.
- To find the total: add all bar values together.
Pictograph vs Bar Graph
| Feature | Pictograph | Bar Graph |
|---|---|---|
| Representation | Uses pictures / icons | Uses rectangular bars |
| Scale | Must have a scale | Has a numbered y-axis |
| Fractional Values | Can have half icons | No icons - just bar heights |
| How to Read | Count icons and multiply by scale | Read value directly from y-axis |
| Best Use | Good for smaller, whole-number data | Good for larger or varied data |
Reading Data from a Picture
Data does not always come in a table or graph. Sometimes you are shown a picture - such as a group of people - and asked to count and compare things you can observe, then decide whether given statements are True or False.
This requires the skill of careful observation and systematic counting.
1. Key Words You Must Understand
| Word / Phrase | What It Means | How to Check |
|---|---|---|
| All | Every single one - no exceptions at all | Even one exception makes it FALSE |
| Some | At least one (could be more) | Find even one example → TRUE |
| No / None | Not even a single one | Find even one example → FALSE |
| More than half | The count is greater than half the total | Half the total and check if count > that |
| Greater than / More than | One count is larger than another | Count both groups, compare using > |
| Fewer than / Less than | One count is smaller than another | Count both groups, compare using < |
How Key Words Work with an Example
- All children are holding books.
Answer: FALSE
Explanation: 7 children are holding books but 3 are not, so not all children have books.- Some children are wearing glasses.
Answer: TRUE
Explanation: 4 children are wearing glasses, so the statement is true.- No child is wearing a cap.
Answer: FALSE
Explanation: 3 children are wearing caps, so the statement is false.- More than half of the children are holding books.
Answer: TRUE
Explanation: There are 10 children, more than half means more than 5, 7 children are holding books, so it is true.- The number of children holding books is greater than the number of children without books.
Answer: TRUE
Explanation: 7 children have books and 3 do not, so 7 is greater than 3.- The number of children wearing caps is fewer than the number of children not wearing caps.
Answer: TRUE
Explanation: 3 children are wearing caps and 7 are not, so 3 is less than 7.

2. Steps to Answer True or False from a Picture
- Read the statement carefully and find the key word (all / some / none / more than half / greater than).
- Count the relevant people or objects in the picture systematically.
- Compare the counts or check if the condition is fully met.
- Mark TRUE only if the statement matches the picture exactly - one exception makes it FALSE.
FAQs on Chapter Notes: Data Through Pictures
| 1. What is the role of a child TV reporter? |  |
| 2. How is stock-taking conducted in a shop? | |
| 3. What are the safety measures for two-wheelers on the road? | |
| 4. Why is recording a day important in data analysis? | |
| 5. What types of data can be collected through pictures? | |


