Types of Data Made Simple

Data is raw information collected from various sources. Understanding the types of data is the first step in data literacy. Different types of data require different methods of collection, analysis, and presentation. This knowledge helps in creating accurate Excel sheets, meaningful charts, and drawing correct insights from information.
1. Qualitative Data vs Quantitative Data
Data can be broadly classified into two major categories based on its nature and how it can be measured.
1.1 Qualitative Data
Qualitative data describes qualities or characteristics that cannot be measured with numbers. It answers questions like "what type?" or "which category?"
- Definition: Data that describes attributes, qualities, or characteristics using words or categories
- Nature: Non-numerical, descriptive, and categorical
- Cannot be: Added, subtracted, multiplied, or divided mathematically
- Also called: Categorical data or attribute data
1.1.1 Commerce-Focused Examples of Qualitative Data
- Customer Feedback: "Excellent", "Good", "Average", "Poor" service ratings
- Product Categories: Electronics, Clothing, Groceries, Stationery
- Payment Methods: Cash, Credit Card, Debit Card, UPI, Net Banking
- Business Types: Sole Proprietorship, Partnership, Company, Cooperative
1.1.2 Types of Qualitative Data
- Nominal Data: Categories with no order or ranking (e.g., Gender: Male/Female, Product Color: Red/Blue/Green)
- Ordinal Data: Categories with a specific order or ranking (e.g., Customer Satisfaction: Very Satisfied > Satisfied > Neutral > Dissatisfied)
1.2 Quantitative Data
Quantitative data consists of numbers and can be measured or counted. It answers questions like "how much?" or "how many?"
- Definition: Data that can be expressed in numerical form and measured
- Nature: Numerical and measurable
- Can be: Added, subtracted, multiplied, divided, and used in calculations
- Also called: Numerical data or metric data
1.2.1 Commerce-Focused Examples of Quantitative Data
- Sales Revenue: ₹50,000, ₹1,25,000, ₹2,00,000
- Number of Products Sold: 150 units, 200 units, 75 units
- Employee Salaries: ₹25,000, ₹40,000, ₹60,000 per month
- Profit Percentage: 15%, 20%, 8.5%
1.3 Comparison Table: Qualitative vs Quantitative Data
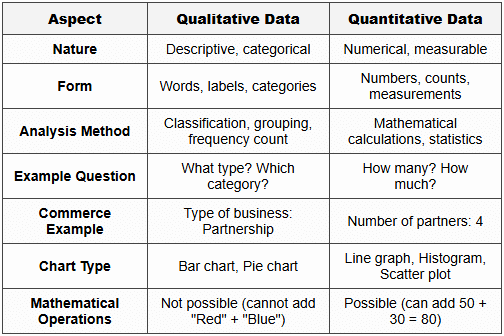
1.4 Common Student Mistakes
- Trap Alert: Numbers that represent categories are qualitative, not quantitative. Example: Mobile numbers (9876543210), PIN codes (110001), Account numbers are qualitative because they identify categories, not quantities
- Trap Alert: Ranks and ratings (1st, 2nd, 3rd or 5-star rating) appear numerical but are ordinal qualitative data because they show order, not measurable quantity
- Confusion Point: Students often think all numbers are quantitative data. Remember: if you cannot perform meaningful mathematical operations, it is qualitative
2. Discrete Data vs Continuous Data
Quantitative data is further divided into two types based on how values can be counted or measured.
2.1 Discrete Data
Discrete data consists of distinct, separate values that can be counted. It cannot take any value between two points.
- Definition: Countable data with specific, separate values (whole numbers only)
- Nature: Obtained by counting
- Values: Usually whole numbers; cannot have decimals or fractions in real scenarios
- Gaps: Clear gaps exist between possible values
2.1.1 Commerce-Focused Examples of Discrete Data
- Number of Customers: 25 customers (not 25.5 customers)
- Number of Invoices Generated: 150 invoices in a month
- Number of Employees: 48 employees in a company
- Number of Products in Stock: 320 units available
2.1.2 Key Characteristics
- Countable: You can list all possible values (1, 2, 3, 4...)
- Finite or Infinite: Can be limited (days in a week: 7) or unlimited (number of sales transactions)
- No In-Between Values: Cannot have 3.7 employees or 15.2 customers
2.2 Continuous Data
Continuous data can take any value within a range. It is obtained by measurement and can have infinite decimal places.
- Definition: Measurable data that can take any value within a given range
- Nature: Obtained by measuring
- Values: Can have decimals and fractions (e.g., 5.75, 12.333)
- No Gaps: Values can exist anywhere on a continuous scale
2.2.1 Commerce-Focused Examples of Continuous Data
- Sales Revenue: ₹1,25,467.50 (can be any value with decimals)
- Weight of Goods: 47.8 kg, 102.35 kg
- Time Taken for Delivery: 2.5 hours, 3.75 hours
- Interest Rate: 6.5%, 8.25%, 9.75% per annum
2.2.2 Key Characteristics
- Measurable: Requires measuring instruments (scale, clock, thermometer)
- Infinite Precision: Value depends on measurement precision (can be 5.7 or 5.75 or 5.7523)
- Range-Based: Can take any value between two limits
2.3 Comparison Table: Discrete vs Continuous Data
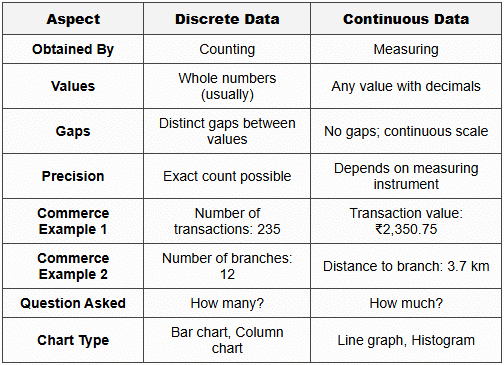
2.4 Common Student Mistakes
- Trap Alert: Money amounts appear discrete but are continuous. ₹500.50 has decimal values, making it continuous data
- Trap Alert: Age is continuous (can be 15.5 years) but often recorded as discrete (15 years) for convenience
- Confusion Point: Time can be both-number of days (discrete: 5 days) vs duration (continuous: 5.5 hours)
- Test Tip: Ask yourself: "Can I count it or must I measure it?" If counting → discrete; if measuring → continuous
3. Integrated Classification of Data
Understanding how different classifications connect helps in choosing the right analysis method and chart type.
3.1 Complete Data Classification Structure
- Level 1: Data → Qualitative or Quantitative
- Level 2 (Qualitative): Nominal (no order) or Ordinal (ordered categories)
- Level 2 (Quantitative): Discrete (countable) or Continuous (measurable)
3.2 Decision Tree for Data Classification
- Step 1: Is the data in numbers? If No → Qualitative; If Yes → Go to Step 2
- Step 2: Can you perform meaningful calculations? If No → Qualitative (like mobile numbers); If Yes → Quantitative, Go to Step 3
- Step 3: Is it obtained by counting or measuring? If Counting → Discrete; If Measuring → Continuous
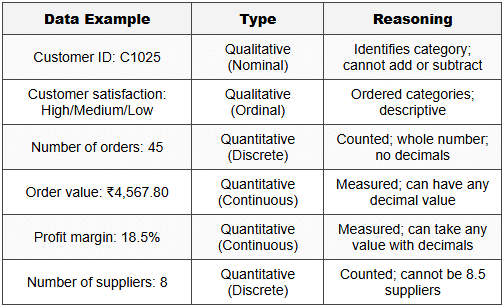
3.3 Commerce-Based Practice Examples
4. Importance in Excel and Data Analysis
Knowing data types helps in organizing Excel sheets correctly and choosing appropriate charts for insights.
4.1 Excel Applications
- Qualitative Data: Use Text format; apply filters for sorting categories
- Quantitative Data: Use Number format; apply formulas like SUM, AVERAGE, MAX, MIN
- Discrete Data: Use whole number format; create frequency tables easily
- Continuous Data: Use decimal format; create class intervals for grouping
4.2 Chart Selection Based on Data Type
- Qualitative Data: Pie chart (shows proportion of categories), Bar chart (compares categories)
- Discrete Quantitative Data: Column chart (compares counts), Bar chart
- Continuous Quantitative Data: Line graph (shows trends over time), Histogram (shows distribution), Scatter plot (shows relationships)
4.3 Key Points for Data Collection
- Consistency: Decide data type before collection to maintain uniformity
- Accuracy: Continuous data needs precise measurement tools
- Recording: Discrete data is easier to record accurately than continuous data
- Analysis Planning: Data type determines which statistical methods can be applied
Understanding the types of data is fundamental for effective data literacy. Distinguishing between qualitative and quantitative data helps in choosing appropriate collection methods. Knowing the difference between discrete and continuous data guides the selection of correct analysis techniques and visualization tools in Excel. These classifications form the foundation for creating meaningful charts and drawing accurate insights from any dataset.


