CFA Level 2 Exam > CFA Level 2 Notes > Quantitative Methods > Mind Map: Time-Series Analysis
Mind Map: Time-Series Analysis

The document Mind Map: Time-Series Analysis is a part of the CFA Level 2 Course Quantitative Methods.
All you need of CFA Level 2 at this link: CFA Level 2
FAQs on Mind Map: Time-Series Analysis
| 1. What are the key components of time series analysis? |  |
Ans. The key components of time series analysis include trend, seasonality, cyclicality, and irregularity. Trend refers to the long-term movement in data, seasonality reflects regular fluctuations within specific time periods, cyclicality indicates long-term oscillations related to economic or business cycles, and irregularity represents random variations that cannot be attributed to trend, seasonality, or cyclic factors.
| 2. How is time series data typically decomposed? | |
Ans. Time series data is typically decomposed into its individual components: the trend component captures the overall direction of the data over time, the seasonal component accounts for regular patterns that repeat at fixed intervals, the cyclical component represents longer-term fluctuations that do not have a fixed period, and the irregular component includes random noise or unforeseen events that affect the data.
| 3. What techniques are commonly used for forecasting in time series analysis? | |
Ans. Common techniques for forecasting in time series analysis include moving averages, exponential smoothing, and ARIMA (AutoRegressive Integrated Moving Average) models. Moving averages smooth out short-term fluctuations to highlight longer-term trends, exponential smoothing gives more weight to recent observations, and ARIMA models combine autoregressive and moving average components for more complex time series forecasting.
| 4. What role does stationarity play in time series analysis? | |
Ans. Stationarity is crucial in time series analysis as it indicates that the statistical properties of the series, such as mean and variance, are constant over time. Many forecasting methods require stationary data because non-stationarity can lead to unreliable and spurious results. Transformations, such as differencing or detrending, are often applied to achieve stationarity.
| 5. Why is it important to understand the autocorrelation function in time series? | |
Ans. Understanding the autocorrelation function (ACF) in time series is important because it measures the correlation between observations at different lags. ACF helps identify the presence of patterns and dependencies within the data, which can inform the selection of appropriate forecasting models, such as ARIMA, and assess the degree of seasonality and cyclicality present in the series.
About this Document

4.68/5 Rating

Apr 22, 2026 Last updated
Related Exams
Document Description: Mind Map: Time-Series Analysis for CFA Level 2 2026 is part of Quantitative Methods preparation. The notes and questions for Mind Map: Time-Series Analysis have been prepared according to the CFA Level 2 exam syllabus. Information about Mind Map: Time-Series Analysis covers topics like and Mind Map: Time-Series Analysis Example, for CFA Level 2 2026 Exam. Find important definitions, questions, notes, meanings, examples, exercises and tests below for Mind Map: Time-Series Analysis.
Introduction of Mind Map: Time-Series Analysis in English is available as part of our Quantitative Methods for CFA Level 2 & Mind Map: Time-Series Analysis in Hindi for Quantitative Methods course. Download more important topics related with notes, lectures and mock test series for CFA Level 2 Exam by signing up for free. CFA Level 2: Mind Map: Time-Series Analysis
Description
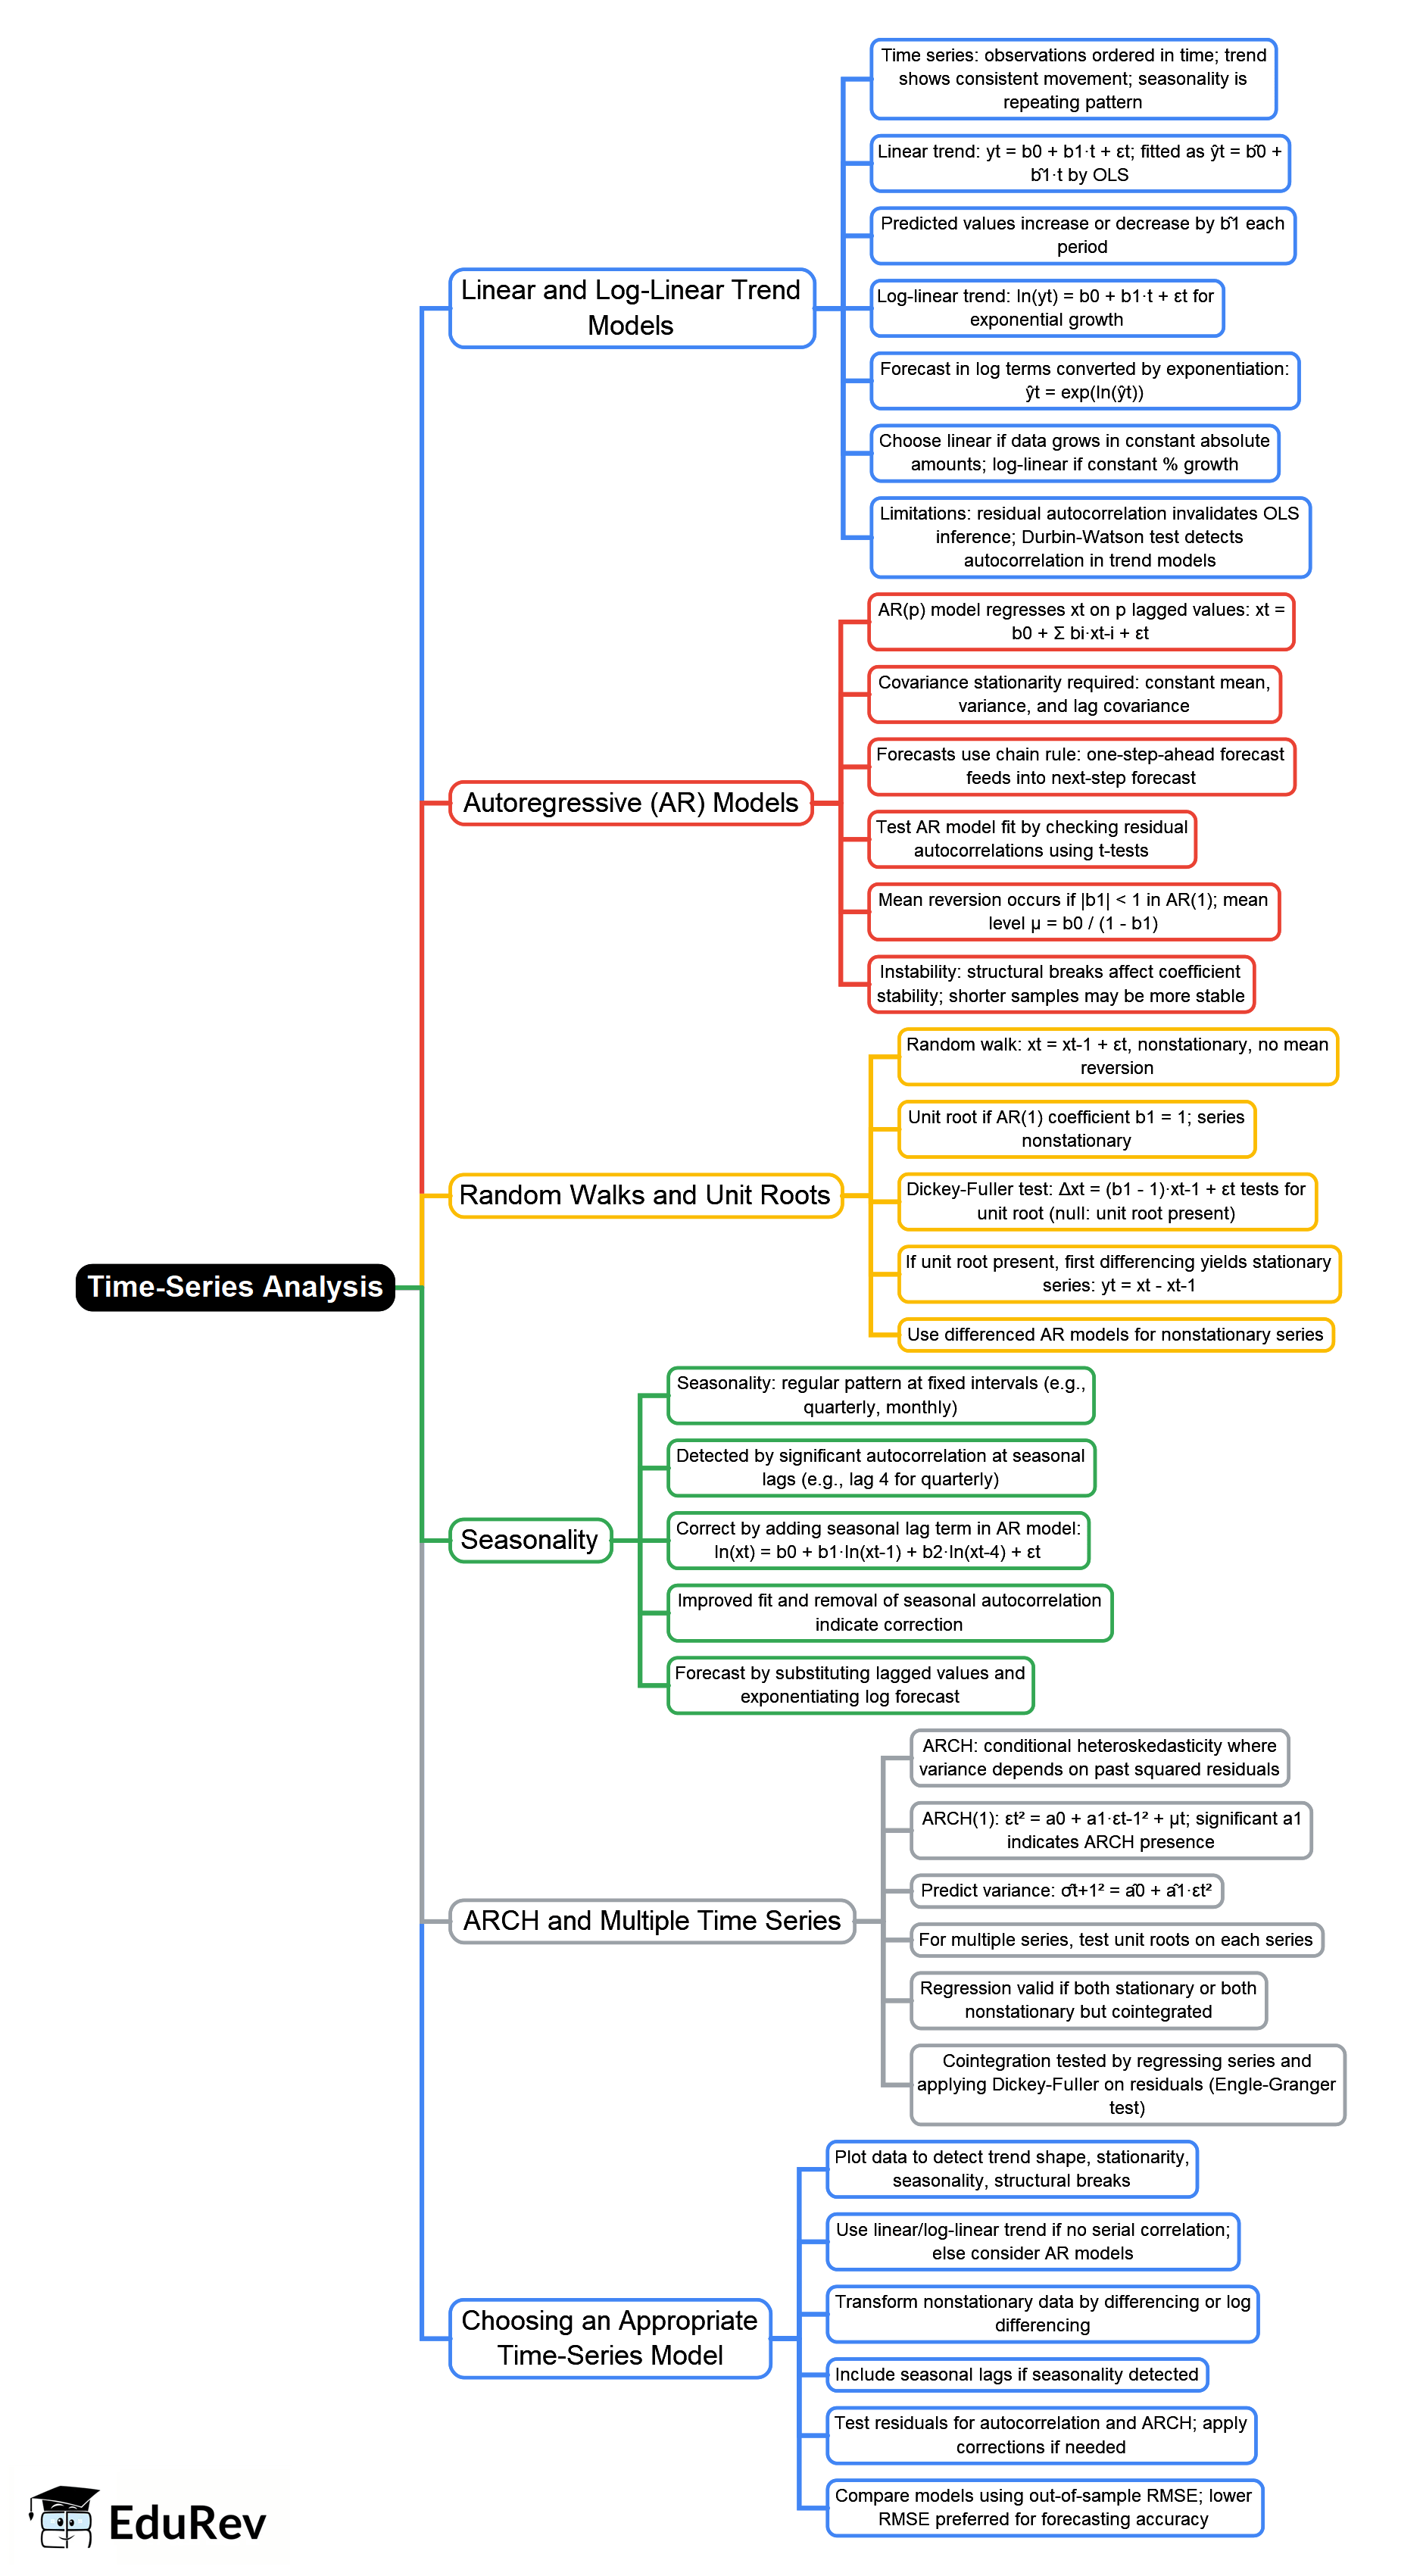
Mind Map: Time of Quant Methods provides you one-page visual summary of the chapter covering all the important topics. Download the PDF from EduRev.
Information about Mind Map: Time-Series Analysis
In this doc you can find the meaning of Mind Map: Time-Series Analysis defined & explained in the simplest way possible. Besides explaining types of Mind Map: Time-Series Analysis theory, EduRev gives you an ample number of questions to practice Mind Map: Time-Series Analysis tests, examples and also practice CFA Level 2 tests


Related Searches
Important questions, study material, Mind Map: Time-Series Analysis, Semester Notes, Objective type Questions, past year papers, Sample Paper, pdf , Viva Questions, Exam, Mind Map: Time-Series Analysis, Mind Map: Time-Series Analysis, practice quizzes, MCQs, video lectures, Extra Questions, ppt, mock tests for examination, Previous Year Questions with Solutions, Free, shortcuts and tricks, Summary;