Chapter Notes: An Overview of Indian Economy


Evolution of the Indian Economy
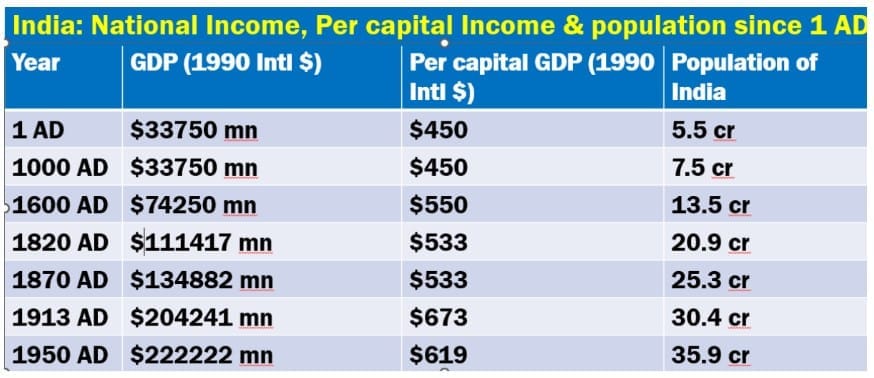
The long-term evolution of the Indian economy can be traced through estimates of national income and global shares of output. Historical reconstructions by scholars such as Angus Maddison show that Asia - especially China and India together - accounted for a very large share of world output in the pre-modern era. Key historical points are:
- 1000 AD: China and India together accounted for about 50.5% of global GDP (computed in 1990 dollars and in PPP terms).
- 1600 AD: China and India together are estimated to have contributed about 52% of world output; this is often disaggregated as roughly 29% for China and 23% for India.
- By the early nineteenth century British colonial rule altered these dynamics; by 1820 India's share had fallen to about 16.1%.
- By the time the British left in 1947, India's share of world income had fallen to roughly 3%, and its share in world trade had declined from about 33% in 1600 to less than 3% in 1947.
- In the contemporary period, according to the International Monetary Fund (IMF, 2021), India's share of global GDP (nominal) was about 7.3%, and by purchasing power parity (PPP) India ranks third globally after the United States and China.
- India is presently one of the world's fastest-growing major economies, though its per-capita income remains low relative to advanced economies.
Economic conditions at the end of the colonial period
British rule substantially changed India's economic structure and performance. Several scholars and Indian nationalists documented the economic effects of colonial policy:
- Dadabhai Naoroji published pioneering estimates of national income in India (1867-68) in his work Poverty and Un-British Rule in India. He estimated British India's national income at about Rs. 340 crore and an average per capita income of roughly Rs. 20 per annum at current prices (the exact dates and measurement conventions vary across reconstructions).
- Other economists (William Digby, Findlay Shirras, V.K.R.V. Rao, R.C. Desai) produced estimates that broadly confirmed very low per capita incomes during colonial times; later reconstructions (Atkinson, Horne, Curzon) produced differing numerical series but a common conclusion of low incomes relative to Britain.
- Cambridge economist Angus Maddison and others have shown a long-run decline in India's share of the world economy from the early modern period to 1947.
- Former Prime Minister Manmohan Singh described India at the turn of the twentieth century as "the brightest jewel in the British Crown and the poorest country in the world, in terms of per capita income."
How British rule affected the Indian economy
Major features of colonial economic policy that affected India's growth and structure include:
- Deindustrialisation: Indian handicraft and artisanal industries, notably textiles, lost competitiveness in the nineteenth century. This decline was aggravated by unfavourable trade policies, changes in demand, and the integration of India into a global economy dominated by British industrial goods.
- Commercialisation of agriculture: Introduction of permanent settlement and other revenue systems changed land relations and pushed many cultivators into market-oriented cropping and debt; systems such as Zamindari, Mahalwari and Ryotwari were used to collect land revenue.
- Wealth drain: The unilateral transfer of resources from India to Britain - through mechanisms such as home charges, dividend payouts, interest on loans raised in Britain, and remittances - led to a net outflow of income without commensurate capital formation in India. Prominent commentators including Edmund Burke and Indian nationalists (Dadabhai Naoroji, R.C. Dutta, C.N. Vakil) analysed this phenomenon.
- Railways and transport: While building transport infrastructure facilitated internal movement of goods and integrated markets, railways were also used to move raw materials to ports and finished goods into the interior, aiding extraction by colonial capital.
- Education and administration: Western education and a British-styled bureaucracy produced a class trained in English and administrative tasks, often criticised as producing functionaries "neither good in English nor Indian culture" (critique used by contemporary nationalists).
Quantifying the colonial drain and income differences
- Under the East India Company, official transfers to the UK rose and by 1856 official transfers were about £3.5 million in that year.
- Estimates indicate that between 1829 and 1865 India paid Britain about £10 crores in household (home) charges, and by the 1930s these levies reached about £40-50 million per year.
- Examples of high colonial incomes: the Viceroy's salary was about £25,000 a year while an entry salary in the engineering service was about £420 a year - illustrating large differentials between British officers and the average Indian labourer.
- Over the long period 1600-1947 India's total GDP rose by only about 2.44 times, whereas Britain's rose by roughly 52 times (estimates depend on base years and conversion conventions).
Basic characteristics of the modern Indian economy
Several structural and socio-economic characteristics define the modern Indian economy: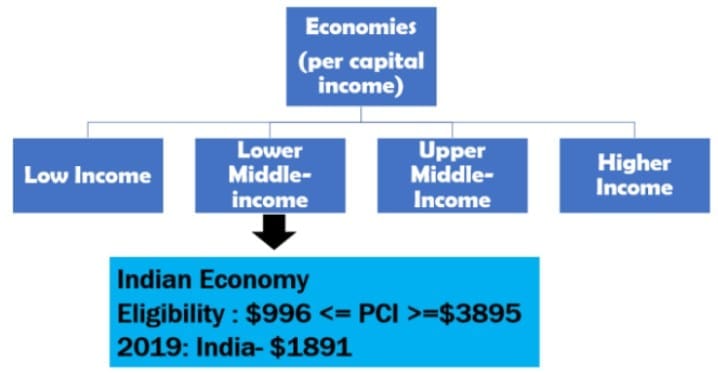
- In terms of Purchasing Power Parity (PPP), India is the third largest economy in the world.
- However, when looking at Per Capita Income (PCI), India has a very low ranking.
- The low per capita income is largely due to high levels of poverty, unemployment, and illiteracy.
- At the time of its independence, India was considered a backward nation. The government responded to developmental challenges through five-year plans, which set specific targets and ensured funding for the growth of different sectors.
- Several factors shape the nature and characteristics of the Indian economy, including:
- Low per capita real income
- Fast population growth
- High rates of unemployment, underemployment, and disguised unemployment
- Heavy dependence on the primary sector
- A vicious cycle of poverty
- Increasing unemployment
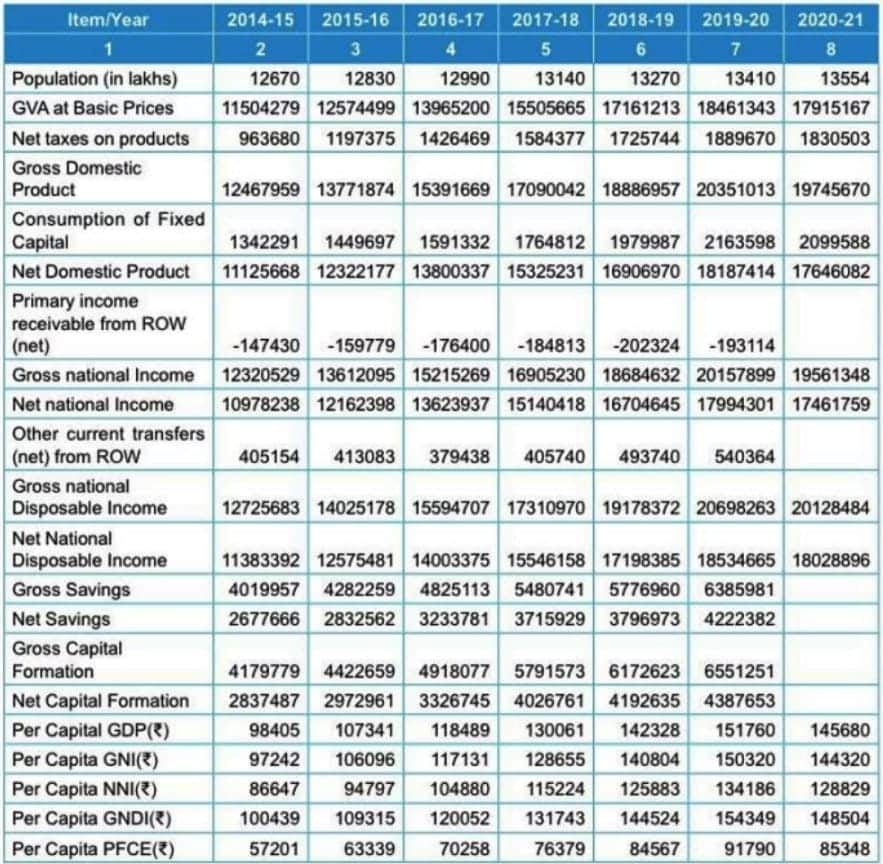
- An extract from India's macro-economic aggregates published by the RBI on September 15, 2021, provides an overview of the economic condition of India.
- India was primarily an agricultural economy, characterized by a very low per capita income.
- After gaining independence, the share of agriculture in the GDP decreased as the sectors of industry and services grew.
- In 1950, agriculture contributed 53.1%to the GDP:
- Industry: 16.6%
- Services: 30.3%
- Following independence and the initiation of the planning phase, the contribution of agriculture continued to decline while the contributions from industry and services increased.
- By 1980-81, the services sector, with a share of 38%, overtook agriculture, which stood at 36.1%, making services the largest contributor to India's GDP.
- The contribution from industry was 25.9%.
Indian Economy In British Period
- During British colonial rule, India's trade, commerce, and investment were negatively affected by the one-sided movement of capital and raw materials to Britain.
- Under British governance, India was seen as a low-quality labor market.
- Statistics showed that fewer than 1 in 6 Indians could read or write.
- In the years 1867-68, Dadabhai Naoroji released the first estimates of India's national income in his book titled "Poverty and Un-British Rule in India".
- In his findings:
- The national income of British India was Rs. 340 crore.
- The per capita income was Rs. 20 per year at current prices.
- By 1948-49, this figure was Rs. 142 per annum.
- Other economists of that time, including William Digby, Findlay Shirras, V.K.R.V. Rao, and R.C. Desai, also estimated India's national income, and their results were very similar.
- Atkinson estimated India's per capita income to be Rs. 172.
- Horne calculated it to be Rs. 158 at 1948-49 prices for the years 1875 and 1891, respectively.
- Curzon projected the per capita income in 1902 to be Rs. 148 in 1948-49 prices.
- However, by 1947, the per capita income had increased to Rs. 250 per year.
- The Cambridge economist Angus Maddison also contributed to this analysis.
Note:
- India's share of global income was:
- In 1600 A.D. it was 23%.
- By the time the British departed in 1947, it had dropped to just 3%.
- Similarly, India accounted for 33% of global trade in 1600 but plummeted to less than 3% by 1947.
- Former Prime Minister Manmohan Singh stated that at the beginning of the 20th century, India was considered the brightest jewel in the British Crown while simultaneously being the poorest country in the world in terms of per capita income.
BRITISH ERA: Discussed in 3 different phases
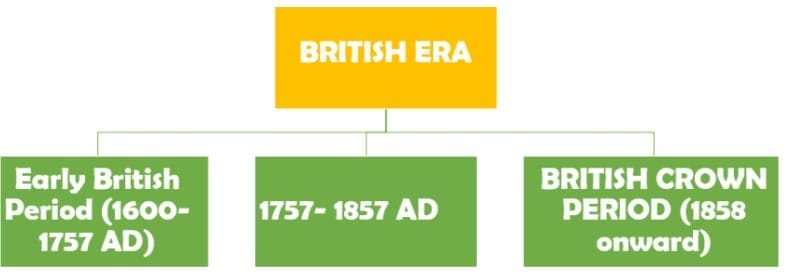
- 3rd Phase: This began in 1857 with the Sepoy Mutiny.
- During this time, India faced colonial exploitationthrough:
- De-industrialization
- Agricultural commercialization
- Wealth drain
- Westernization of Indian education systems
- When the British left, India was a poor economy.
- Global GDP: Decreased from 23% in 1600 to 3% in 1947.
- Global exports: Dropped from 33% to 3%.
- Introduced the Zamindari, Mahalwari, and Ryotwari systems, which imposed heavy land taxes on farmers.
- Commercialization led to:
- A new class of intermediaries
- More frequent famines
- Farmers becoming landless laborers
- Deindustrialization:Happened in the mid-19th century due to:
- The fall of the Mughal Empire
- The decline of Indian agriculture
- An increase in nominal wages
- A drop in the competitiveness of Indian textiles
- Better transportation facilities
- The trade policies were unfavorable to India, which worsened the decline of trade and worsened deindustrialization.
- Railways: Helped the British transport goods from rural areas to ports and back, and allowed British investors to profit from railway construction.
- The main aim of introducing Western education in India was to create a group of Indians who were not proficient in either English or Indian culture.
Important Point
- Wealth drain: The one-sided transfer of riches from India to Britain without sufficient economic benefits in return.
- This occurred through:
- Remittances
- Home charges
- Revenue transfers from private businesses or investments
- Many British thinkers and Indian nationalists, such as Dadabhai Naoroji, R.C. Dutta, and C.N. Vakil, researched and wrote about this wealth drain.
- In 1783, Edmund Burke described how economic drain contributed to poverty in India.
- In 1776, Philip Francis analyzed the economy of the drain and categorized it into four main areas.
- According to Angus Maddison's findings, India's share of the world economy dropped from 23% in 1600 to 3% in 1947.
- Clive took £250,000 for himself and a Jagir worth £27,000 a year.
- The salaries for British officials were very high:
- The Viceroy earned £25,000 a year
- Governors received £10,000
- The starting salary in the engineering service was £420 a year, which was about sixty times the average income of Indian workers.
- Under the East India Company, the official transfers to the UK gradually increased, reaching about £3.5 million in 1856, the year before the mutiny.
- Private remittance: From 1858 to 1947, the money transfers by the colonial government to the UK were known as "Home Charges."
- These included:
- Dividends to East India Company shareholders
- Interest on loans from the Government of India to England
- Expenses for the British army in India
- Pensions and annuities for retired British officers
- Guaranteed interest payments to railway companies
- Salaries for the Secretary of State for India and his staff
- According to Dadabhai Naoroji, India paid Britain £10 crores in home charges between 1829 and 1865.
- By the 1930s, these charges were around £40-50 million each year.
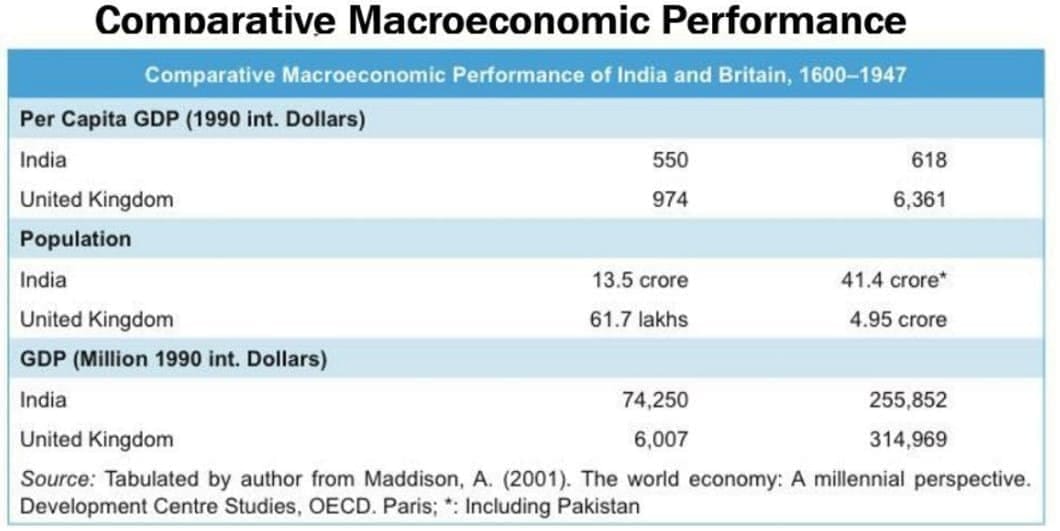
- India's per capita income from 1600-1947 increased by 12% whereas the increase for Britain for the same period was 55%.
- India's total GDP during 1600-1947 increased by 2.44 times, but for Britain the rise was 52 times.
Economy Till 2008 & After 2008
1951-1980
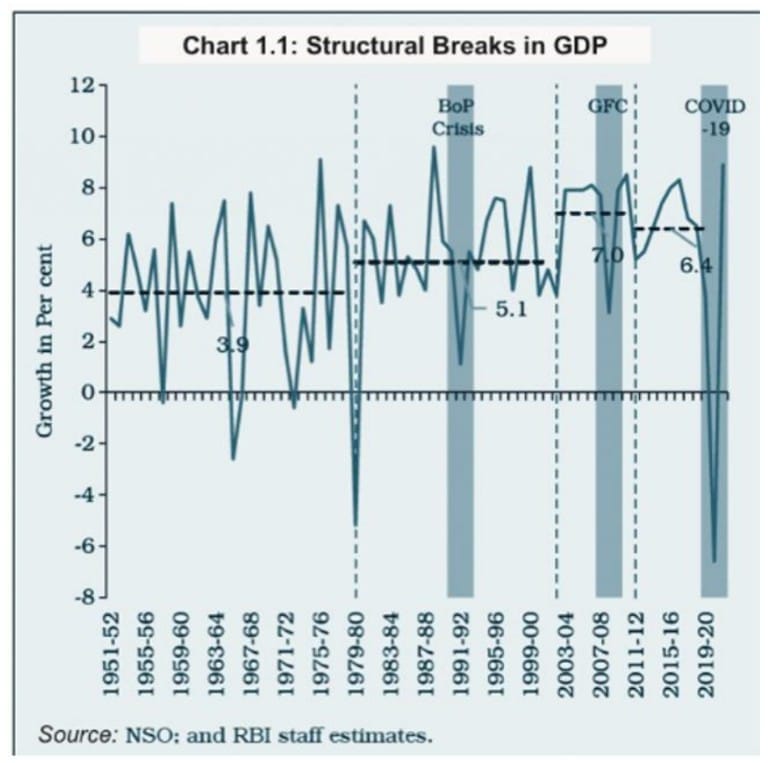
- First three decades: The growth rate of India was quite slow.
- In 1978, Professor Raj Krishna introduced the term "Hindu rate of growth" to explain the sluggish pace of the Indian economy.
- The term highlights:
- The low annual growth rate of India's planned economy, which was about 3.5% from the 1950s to the 1980s.
- The average growth of per capita income was only 1.3%.
1980-90
- Economic Growth Period: The time of strong economic improvement and recovery.
- 6th Five-Year Plan: From 1980 to 1985, India managed to overcome the problem known as the 'Hindu Rate of Growth'.
- Increased Government Spending: There was a rise in government spending that acted as a stimulus for the economy, leading to better economic growth.
- Liberalized Import Policies: The changes in import rules allowed for more imports of capital goods and raw materials for manufacturing, which helped increase the production of luxury goods in the country.
2008 to 2021
- The year 2008 was marked by a sense of optimism as many believed that the Indian economy was separate from the economic troubles of developed countries, especially after the Lehman Brothers collapse on September 15, 2008.
- In September 2008, India took significant steps to address the situation.
- To lessen the impact of the crisis, the government introduced a fiscal stimulus for the economy.
- There were three stimulus packages amounting to Rs. 1.86 lakh crore, which is about 3.5% of the GDP.
- The Reserve Bank of India (RBI) made monetary policies easier and provided Rs 5.6 lakh crore (approximately 9% of GDP) in both local and foreign liquidity.
- The economy began to recover, but this came with a larger fiscal deficit, which went beyond the limits set by the Fiscal Responsibility and Budget Management Act.
- The fiscal stimulus was never completely removed, leading to an increase in the current account deficit (CAD).
- The rapid economic growth of the past decade boosted credit growth as the economy's ability to produce increased significantly.
- Several important policies were put into effect, including:
- Goods and Services Tax (GST)
- Insolvency and Bankruptcy Code (IBC)
- corporate tax cuts
- demonetisation
- Before the COVID-19 pandemic, the average annual growth rate of the economy from 2008-09 to 2019-20 was 6.5% (using 2011-12 prices as the base).
- In 2019-20, the economy only grew by 4.0%.
Structural Changes In Indian Economy
Indian economy and the COVID-19 shock
The COVID-19 pandemic was a major shock starting in late 2019 and had deep economic consequences in India. Key chronological and economic facts:
- End of December 2019: First officially reported cases in Wuhan, China.
- 11 March 2020: COVID-19 declared a global pandemic by the World Health Organization.
- 30 January 2020: India recorded its first confirmed COVID-19 case.
- 16 January 2021: India launched its national vaccination programme.
- India experienced at least three waves of infections by mid-2022. The initial nationwide lockdown in 2020 was one of the most stringent and had a large short-run economic impact.
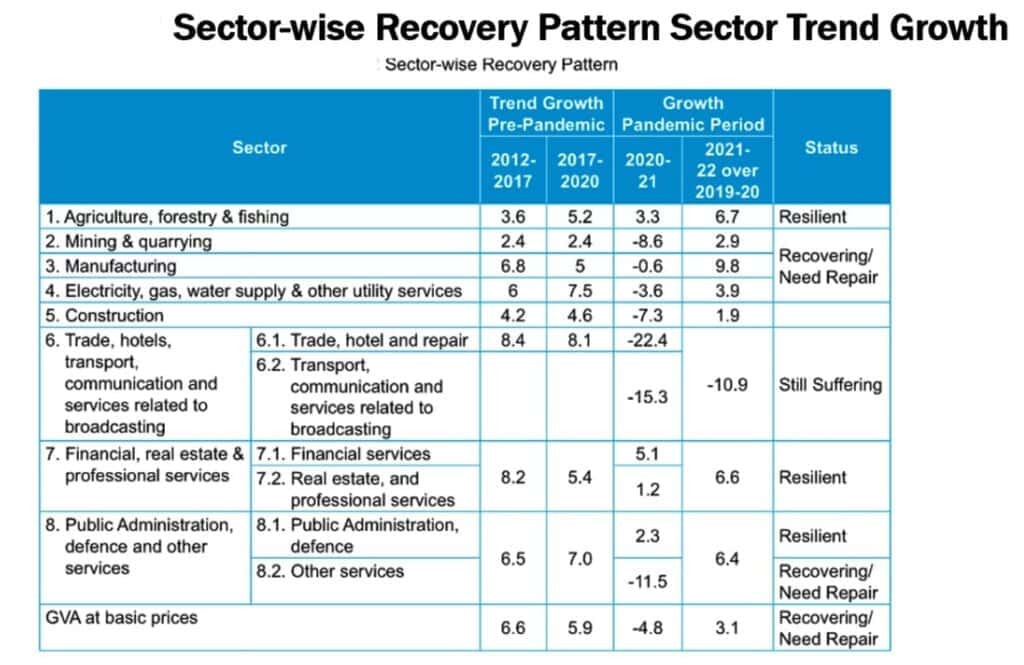
Sectoral Impact of COVID-19
- Due to strict restrictions, services that require close contact were nearly stopped during the pandemic.
- The services sector, which includes most of the contact-based and non-essential activities in India, faced the greatest challenges from the pandemic's effects.
- The pandemic has lowered the profits of contact-heavy businesses such as:
- retail trading,
- hotels and restaurants,
- air transportation services,
- transport logistics services, and
- education.
- The real estate and automobile sectors were hit hard by the pandemic, but there were already signs of a slowdown in these areas before the pandemic started.
The Indian labour market:
- Severe decline during the first wave of the epidemic.
- Unemployment reached its highest level ever.
- Labour force participation dropped significantly.
- Many people moved back from cities to villages, which increased the need for the Mahatma Gandhi National Rural Employment Guarantee Scheme (MGNREGS) jobs in rural areas.
- The second and third waves of the pandemic had less of an effect, and work conditions became more stable.
- Due to the lockdown, investment demand came to a halt in the first quarter of 2020-21, resulting in a major decline.
- The recovery of gross fixed capital formation (GFCF) sped up, mainly driven by active government investments, which were the only sector that positively influenced investment demand in 2020-21.
- Agriculture remained strong in terms of production during the pandemic because agricultural activities were not affected by the lockdown.
- Manufacturing, mining and quarrying, and the supply of electricity, gas, and water all experienced significant declines.
- Manufacturing, which had initially led the recovery after the first wave, stayed strong during the second wave.
Economic contraction and recovery dynamics
The macroeconomic path during 2020-22 shows a sharp contraction followed by a strong rebound:
- Q1 2020-21: GDP contracted by about 23.8% (quarter-on-quarter annualised reported contraction for the quarter during the strict lockdown period).
- Subsequent quarters showed recovery: by Q3 2020-21 growth was reported at 0.7% and by Q4 at 2.5%, leaving the fiscal year 2020-21 with a contraction of about 6.6%.
- 2021-22 recovery: The economy rebounded strongly supported by a low base effect, policy measures and reopening. Quarterly growth rates for 2021-22 were: Q1 20.1%, Q2 8.4%, Q3 5.4% and Q4 4.1%.
- Estimated real GDP growth for 2021-22 was about 8.7% compared with a contraction of 6.6% in 2020-21.
- Estimated GDP at constant (2011-12) prices for 2021-22 was approximately Rs. 147.36 lakh crore. Nominal GDP for 2021-22 was estimated at about Rs. 236.65 lakh crore (a growth of about 19.5% over 2020-21 nominal GDP of Rs. 198.01 lakh crore).
Post-COVID outlook and medium-term projections
- The growth rate before COVID-19 was 6.6% (CAGR from 2012-13 to 2019-20).
- According to RBI, using a growth rate of:
- -6.6% for 2020-21,
- 8.9% for 2021-22,
- 7.2% for 2022-23, and
- 7.5% beyond that,
- This means that India is expected to recover from the pandemic losses in a period of 12 years.
- Structural change refers to the significant shifts that have taken place in important parts of the Indian economy over time.
- The contribution of the primary sector to GDP has been decreasing over time, while the secondary and tertiary sectors have been increasing.
- In the long term, the tertiary sector becomes the biggest contributor to the economy, surpassing the secondary sector.
- In India, the services sector has largely taken the place of the industrial sector and now leads the economy.
- As income grows, the importance of the primary sector declines, and India follows this trend.
- The share of agriculture in GDP has been consistently falling:
- From 26.9% in 1990,
- To 21.6% in 2000,
- To 17.8% in 2010, and
- To 17.7% in 2019,
- The COVID-19 pandemic has increased the primary sector's share in the economy since agriculture was the only sector permitted to operate normally during the lockdown.
- In 2020-21, the contribution to the economy was:
- 60.9% from the services sector,
- 19.8% from the secondary sector, and
- 20.1% from the primary sector.
- A study of the nature and reasons for structural change in the Indian economy shows that the services sector drives both industry and the overall economy, with its growth influenced by external factors like foreign direct investment.
Summary
Key takeaways from the historical and recent evolution of the Indian economy: India's long-run decline in share of world output between the early modern period and 1947 is a major historical fact that influenced its initial conditions at independence. Colonial policies - deindustrialisation, commercialisation of agriculture, and flows of wealth to Britain - materially affected India's economic structure and income levels. Post-independence, India experienced slow growth for several decades (the so-called "Hindu rate of growth") followed by episodes of faster growth from the 1980s and structural changes that increased the services sector's share. The global financial crisis of 2008 and the COVID-19 pandemic were major shocks that elicited fiscal and monetary policy responses; reforms such as GST and IBC aimed to strengthen the institutional and tax base of the economy. Sectoral shifts show a declining share of agriculture and a rising dominance of services; labour market vulnerabilities and inequality remain important policy challenges.
FAQs on Chapter Notes: An Overview of Indian Economy
| 1. What are the key features of the modern Indian economy? |  |
| 2. How has the Indian economy evolved over time? | |
| 3. What role does agriculture play in the Indian economy? | |
| 4. What is the significance of the service sector in the Indian economy? | |
| 5. How does globalisation impact the Indian economy? | |