Financial Statement Analysis


Financial Statement Analysis forms the foundation for evaluating a company's financial health, performance, and future prospects. This discipline involves examining financial statements to extract meaningful insights for investment decisions, credit analysis, and business valuation. Understanding the financial reporting environment, the roles of various financial statements, and the analytical framework is critical for making informed economic decisions. This topic emphasizes both the utility and limitations of financial statements, while comparing major accounting standards like IFRS and US GAAP.
1. Financial Reporting Environment
The financial reporting environment consists of the framework, regulations, and participants that govern how companies prepare and present financial information to stakeholders.
1.1 Standard-Setting Bodies
- IASB (International Accounting Standards Board): Issues International Financial Reporting Standards (IFRS). Used in over 140 countries including EU, India, Australia, Canada.
- FASB (Financial Accounting Standards Board): Issues US Generally Accepted Accounting Principles (US GAAP). Primary standard-setter for United States.
- SEC (Securities and Exchange Commission): US regulatory body that oversees financial reporting for publicly traded companies. Has legal authority to establish accounting standards but delegates to FASB.
- IOSCO (International Organization of Securities Commissions): Endorses IFRS for cross-border securities offerings.
1.2 Regulatory Framework Components
- Conceptual Framework: Underlying principles that guide accounting standard development. Defines objectives, qualitative characteristics, and elements of financial statements.
- Accounting Standards: Specific rules and guidance for recognition, measurement, presentation, and disclosure of transactions.
- Auditing Standards: Guidelines for independent verification of financial statements (ISA - International Standards on Auditing; PCAOB standards in US).
- Enforcement Mechanisms: Legal and regulatory penalties for non-compliance, including fines, delisting, and criminal prosecution.
1.3 Financial Reporting Objectives
According to the IASB and FASB Conceptual Framework, the primary objective is to provide financial information that is useful to existing and potential investors, lenders, and other creditors in making decisions about providing resources to the entity.
- Primary users: Investors, lenders, other creditors (resource providers)
- Decision types: Buying, selling, holding equity/debt instruments; providing/settling loans; voting rights exercise
- Information needs: Assessing future cash flows to the entity; evaluating management's stewardship of resources
2. Role of Financial Statements
Financial statements are structured representations of the financial position, performance, and cash flows of an entity. They serve multiple analytical purposes for different user groups.
2.1 Complete Set of Financial Statements
- Statement of Financial Position (Balance Sheet): Reports assets, liabilities, and equity at a specific point in time. Formula: Assets = Liabilities + Equity
- Statement of Comprehensive Income: Reports all revenues, expenses, gains, and losses for a period. Includes both net income and Other Comprehensive Income (OCI).
- Statement of Changes in Equity: Shows movements in equity components including share capital, retained earnings, and reserves.
- Statement of Cash Flows: Reports cash inflows and outflows classified into operating, investing, and financing activities.
- Notes to Financial Statements: Provides additional disclosure, accounting policies, detailed breakdowns, and explanatory information.
2.2 Key Roles and Functions
- Performance Evaluation: Assessing profitability, efficiency, and growth trends over time using income statement and ratios.
- Financial Position Assessment: Evaluating liquidity, solvency, and capital structure using balance sheet analysis.
- Cash Flow Analysis: Determining cash generation ability, sustainability of operations, and financing/investing patterns.
- Valuation Inputs: Providing data for discounted cash flow models, relative valuation multiples, and asset-based valuations.
- Credit Analysis: Evaluating debt-servicing capacity, collateral availability, and default probability.
- Stewardship Assessment: Monitoring management's efficiency in using shareholders' resources.
2.3 Accrual vs Cash Basis
- Accrual Accounting: Revenues recognized when earned (not when cash received); expenses matched to revenues. Required under IFRS and US GAAP. Provides better measurement of economic performance.
- Cash Basis: Records transactions only when cash changes hands. Simpler but can distort performance measurement. Not acceptable for general purpose financial statements.
- Key difference: Accrual accounting separates operating performance from financing and timing effects of cash flows.
3. IFRS vs US GAAP Overview
While IFRS and US GAAP share similar conceptual frameworks, important differences exist in recognition, measurement, and disclosure requirements. Understanding these differences is critical for analyzing companies across jurisdictions.
3.1 Fundamental Approach Differences
- IFRS: Principles-based approach emphasizing professional judgment and substance over form. More flexible interpretation.
- US GAAP: Rules-based approach with detailed specific guidance and bright-line thresholds. More prescriptive requirements.
- Convergence efforts: FASB and IASB worked on convergence projects (2002-2016), achieving alignment in some areas but significant differences remain.
3.2 Key Differences - Recognition and Measurement
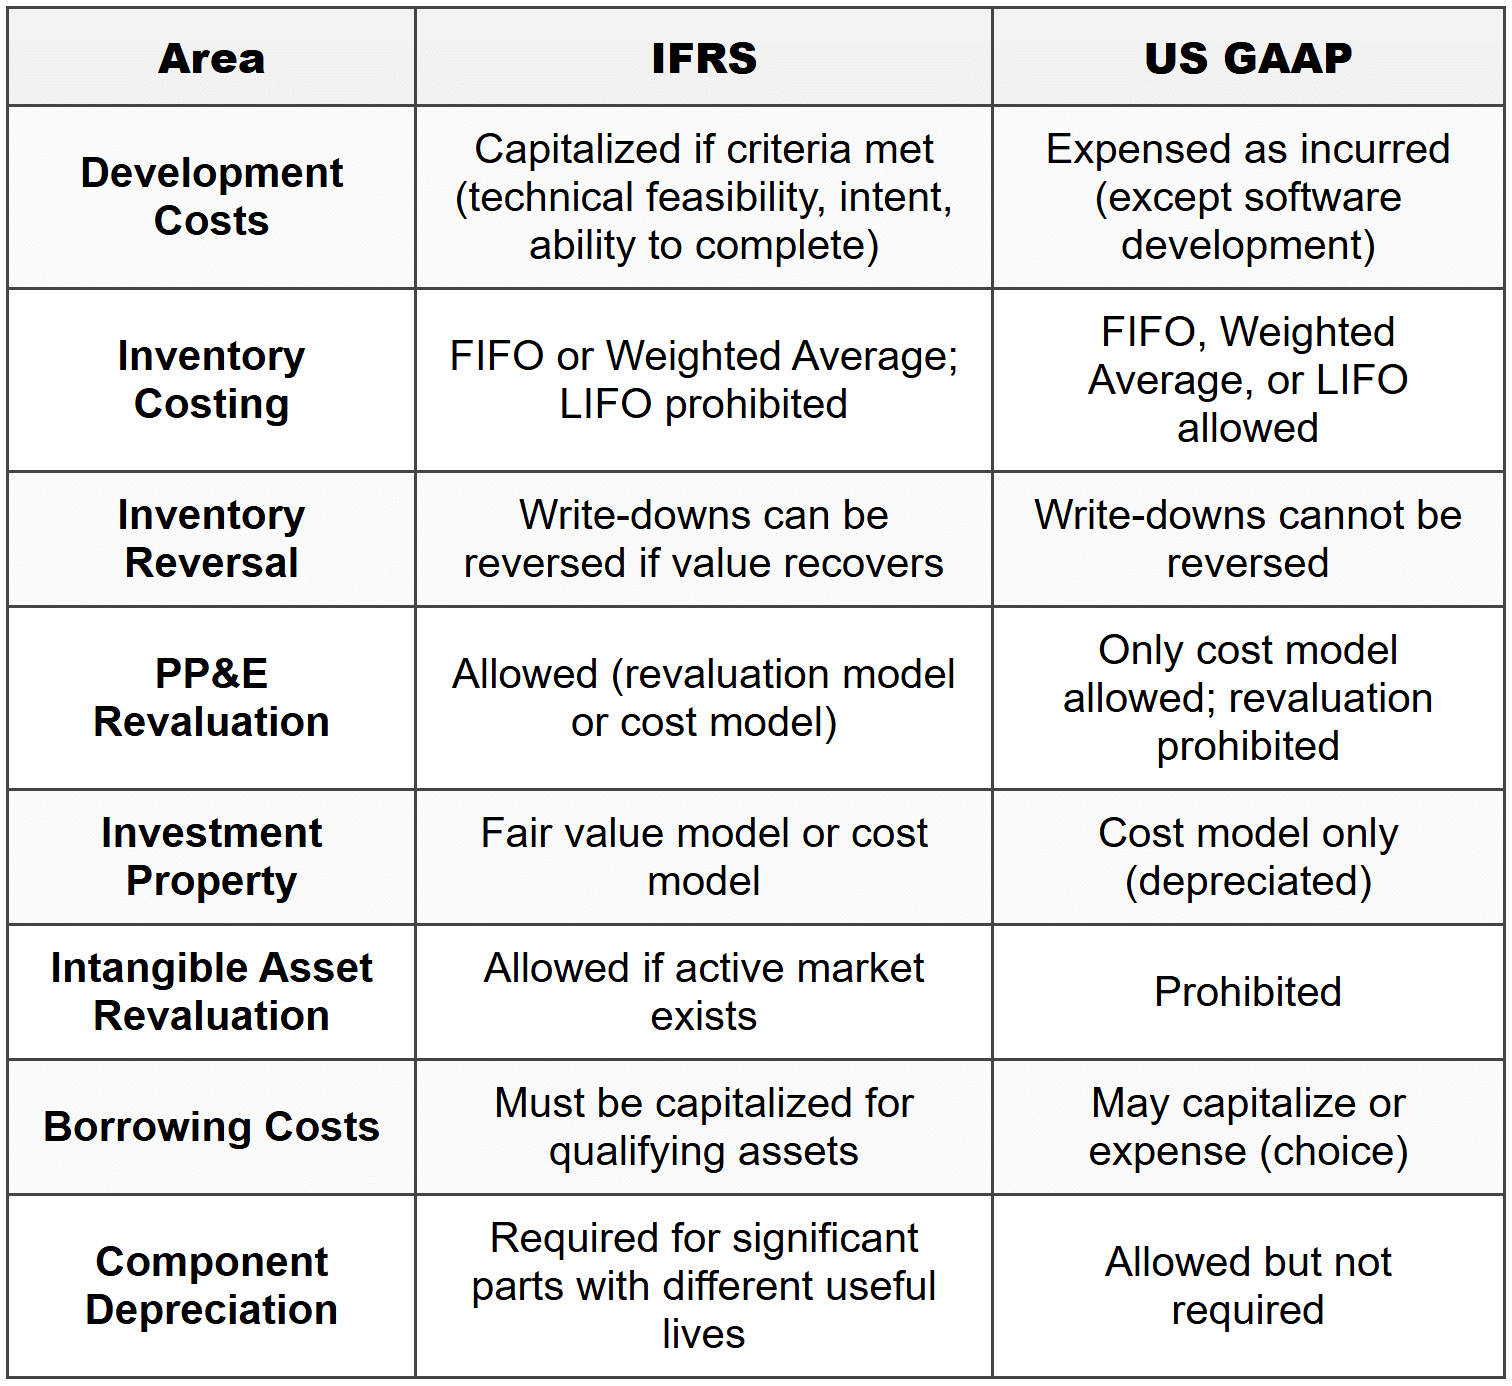
3.3 Key Differences - Presentation and Classification
- Balance Sheet Format: IFRS allows current/non-current or liquidity-based presentation; US GAAP typically requires current/non-current classification.
- Income Statement: IFRS requires minimum line items; US GAAP provides more detailed guidance on extraordinary items (though now eliminated) and classification.
- Extraordinary Items: IFRS prohibits classification as extraordinary; US GAAP eliminated this category in 2015.
- Cash Flow Classification: Interest and dividends received/paid - IFRS allows flexibility (operating or investing/financing); US GAAP has specific requirements (interest received/paid = operating, dividends received = operating, dividends paid = financing).
3.4 Revenue Recognition
Both standards now follow similar five-step model after convergence (IFRS 15 and ASC 606):
- Identify the contract with customer
- Identify performance obligations
- Determine transaction price
- Allocate transaction price to performance obligations
- Recognize revenue when performance obligation is satisfied
Minor differences: US GAAP has more industry-specific guidance; threshold for contract modification treatment varies slightly.
3.5 Financial Instruments
- Classification: Both use similar models based on business model and cash flow characteristics (IFRS 9 and ASC 326).
- Impairment: IFRS uses expected credit loss model from initial recognition; US GAAP uses current expected credit loss (CECL) model.
- Key difference: IFRS has three-stage approach for loss recognition; US GAAP applies lifetime expected losses immediately.
4. Financial Statement Users
Different user groups analyze financial statements with distinct objectives, information needs, and decision contexts. Understanding these perspectives helps interpret reporting choices and analytical priorities.
4.1 Primary Users
- Equity Investors: Assess profitability, growth potential, dividend capacity, and valuation. Focus on earnings quality, return on equity (ROE), earnings per share (EPS), and price multiples.
- Debt Holders/Creditors: Evaluate credit risk, debt-servicing capacity, and collateral value. Emphasize cash flow coverage ratios, leverage ratios, and asset quality.
- Analysts (Buy-side/Sell-side): Perform detailed analysis for investment recommendations. Conduct forecasting, valuation modeling, peer comparisons, and quality assessments.
- Rating Agencies: Assign credit ratings based on default probability assessment. Analyze cash flow stability, financial flexibility, and business risk factors.
4.2 Secondary Users
- Management: Uses financial statements for performance monitoring, strategic planning, and external communication. Also primary preparer of statements.
- Board of Directors: Oversees management performance and approves financial statements. Assesses achievement of strategic objectives.
- Employees: Evaluate job security, compensation potential, and company stability. Interest in profitability and cash flow sustainability.
- Suppliers/Vendors: Assess customer creditworthiness and business continuity. Focus on liquidity and payment capacity.
- Customers: Evaluate supplier reliability and long-term relationship viability, especially for critical or specialized products.
- Government/Regulators: Monitor compliance with regulations, tax calculations, and economic statistics compilation.
- Competitors: Benchmark performance, market share, and strategic positioning. Analyze profitability margins and efficiency metrics.
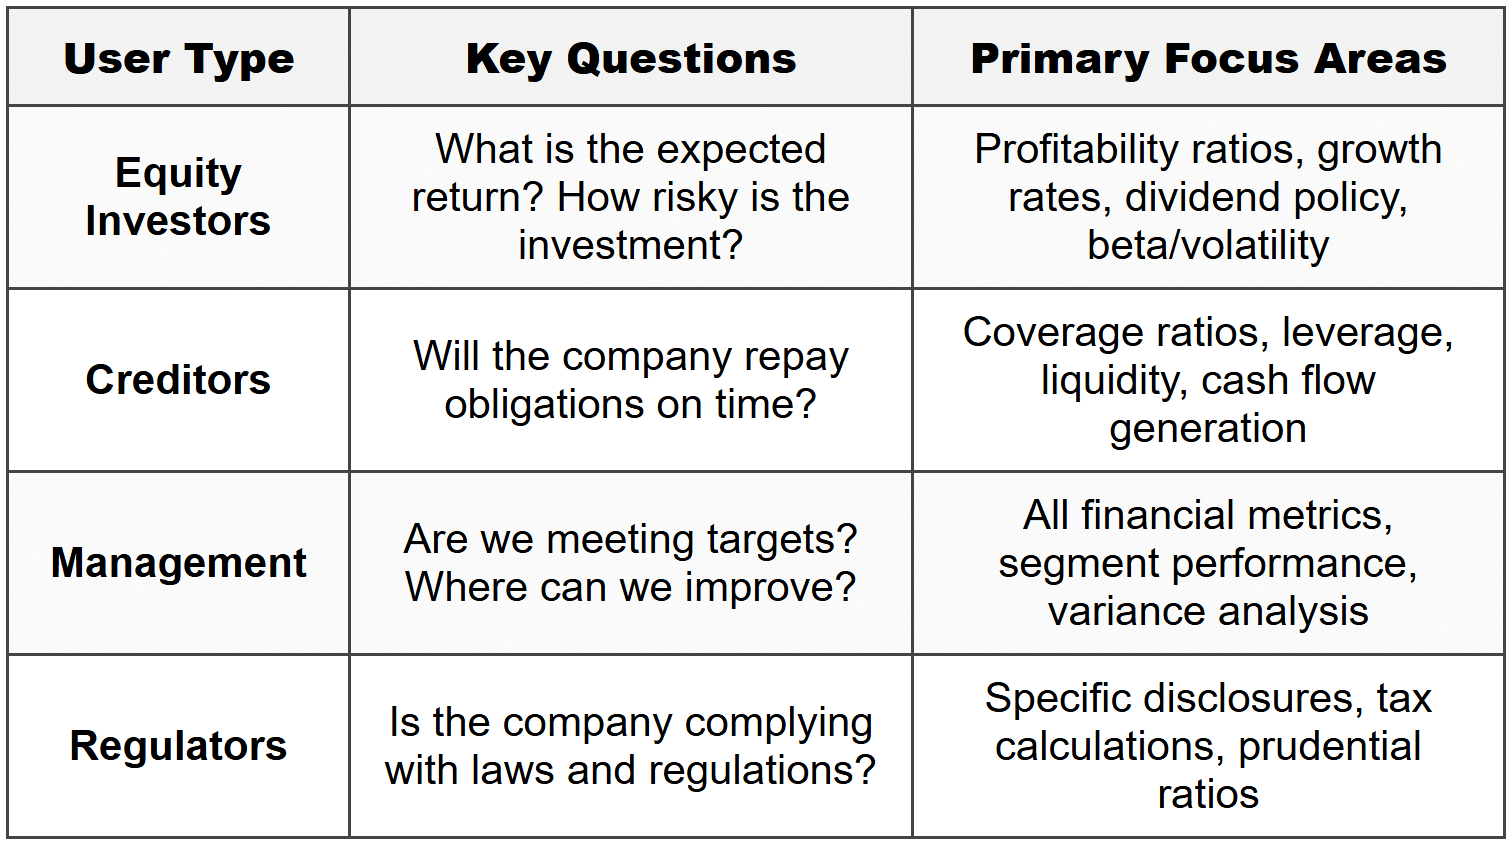
4.3 Information Needs by User Type
5. Analytical Framework
A systematic framework ensures comprehensive and consistent financial statement analysis. This structured approach minimizes oversight of important factors and facilitates comparison across companies and time periods.
5.1 Six-Phase Analytical Framework
Phase 1: State the Objective and Context
- Define purpose of analysis (valuation, credit assessment, acquisition due diligence, etc.)
- Identify the specific questions to be answered
- Determine time frame and scope of analysis
- Consider regulatory, economic, and industry context
Phase 2: Gather Data
- Collect complete set of financial statements for multiple periods (typically 3-5 years)
- Obtain industry and competitor data for benchmarking
- Review management discussion and analysis (MD&A), earnings calls, press releases
- Gather macroeconomic and industry research reports
- Access audit reports, proxy statements, and regulatory filings
Phase 3: Process Data
- Make necessary adjustments for comparability (accounting policy differences, one-time items)
- Calculate common-size financial statements (vertical analysis)
- Compute financial ratios across categories (liquidity, solvency, profitability, efficiency, valuation)
- Prepare trend analysis (horizontal analysis) for key metrics
- Create cash flow analytics and quality assessments
Phase 4: Analyze/Interpret Data
- Conduct cross-sectional analysis: Compare company with industry peers and benchmarks
- Perform time-series analysis: Evaluate trends, cyclicality, and volatility over time
- Apply analytical techniques: ratio analysis, DuPont analysis, cash flow analysis, segment analysis
- Identify strengths, weaknesses, opportunities, and threats
- Assess earnings quality, accounting choices, and red flags
Phase 5: Develop and Communicate Conclusions
- Synthesize findings into coherent investment thesis or recommendation
- Support conclusions with specific evidence from analysis
- Address limitations and uncertainties in analysis
- Prepare clear, structured report or presentation
- Tailor communication to audience needs and expertise
Phase 6: Follow-up
- Monitor actual performance versus forecasts and expectations
- Update analysis as new information becomes available (quarterly reports, news)
- Reassess conclusions and adjust recommendations as needed
- Document lessons learned for future analyses
5.2 Key Analytical Tools and Techniques
Common-Size Analysis (Vertical Analysis):
- Income Statement: Express all items as percentage of revenue/sales
- Balance Sheet: Express all items as percentage of total assets
- Facilitates comparison across companies of different sizes and across time periods
- Formula: Common-size value = (Line item / Base amount) × 100
Trend Analysis (Horizontal Analysis):
- Calculate percentage change in financial statement items over time
- Select base year and index subsequent years to base year = 100
- Formula: Percentage change = [(Current year value - Base year value) / Base year value] × 100
- Identifies growth patterns, cyclicality, and structural changes
Ratio Analysis Categories:
- Activity Ratios (Efficiency): Measure how effectively company uses assets (inventory turnover, receivables turnover, asset turnover)
- Liquidity Ratios: Assess ability to meet short-term obligations (current ratio, quick ratio, cash ratio)
- Solvency Ratios: Evaluate long-term financial risk (debt-to-equity, debt-to-assets, interest coverage)
- Profitability Ratios: Measure returns generated (net margin, operating margin, ROA, ROE)
- Valuation Ratios: Relate market price to fundamentals (P/E, P/B, P/S, EV/EBITDA)
DuPont Analysis: Decomposes ROE into components to identify performance drivers:
- Three-component model: ROE = Net Profit Margin × Asset Turnover × Equity Multiplier
- Formula: ROE = (Net Income/Sales) × (Sales/Assets) × (Assets/Equity)
- Five-component model: Further breaks down into Tax Burden × Interest Burden × EBIT Margin × Asset Turnover × Leverage
- Identifies whether ROE driven by profitability, efficiency, or leverage
5.3 Common Pitfalls in Analysis
- Trap Alert: Focusing solely on ratios without understanding underlying business economics and accounting policies. Ratios are symptoms, not causes.
- Trap Alert: Comparing companies without adjusting for different accounting methods (LIFO vs FIFO, capitalization vs expensing).
- Trap Alert: Ignoring qualitative factors (management quality, competitive position, regulatory risks) that financial statements don't fully capture.
- Trap Alert: Using single-year data that may be distorted by one-time events. Always analyze multiple periods.
6. Quality of Financial Reporting
Financial reporting quality encompasses both the quality of financial statements (compliance with standards) and the quality of reported results (economic reality representation). High-quality reporting provides decision-useful information; low-quality reporting obscures true performance.
6.1 Dimensions of Reporting Quality
GAAP Compliance Spectrum:
- High Quality: Complies with GAAP, decision-useful, sustainable, and adequate returns. Reflects economic reality faithfully.
- Low Quality (within GAAP): Complies with GAAP but uses aggressive accounting choices, minimal disclosure, or biased estimates to manage earnings.
- Non-compliant (Fraudulent): Violates GAAP through fictitious transactions, misstated amounts, or omitted information. Examples: Enron, WorldCom, Satyam.
6.2 Earnings Quality Indicators
High Earnings Quality Characteristics:
- Sustainable and adequate level of earnings to cover capital costs and provide returns
- Backed by actual cash flows: Operating cash flow ≥ Net income over time
- Conservative accounting: Prompt expense recognition, delayed revenue recognition when uncertain
- Consistent application of accounting policies without frequent changes
- Minimal one-time items: Recurring earnings form bulk of reported income
- Transparent disclosures: Clear explanation of significant judgments and estimates
Red Flags for Low Earnings Quality:
- Revenue recognition issues: Recording revenue prematurely, channel stuffing, bill-and-hold arrangements
- Aggressive capitalization: Capitalizing expenses that should be expensed (software, R&D)
- Cookie jar reserves: Creating excessive reserves in good years to boost earnings in poor years
- Classification shifting: Moving recurring expenses to non-recurring categories to inflate core earnings
- Operating cash flow < net="" income=""> Suggests earnings not converting to cash
- Days Sales Outstanding (DSO) increasing significantly: May indicate aggressive revenue recognition or collection problems
- Inventory/Sales ratio increasing: Potential obsolescence or demand weakness
6.3 Balance Sheet Quality Assessment
- Asset Quality: Are assets valued appropriately? Look for impaired assets, outdated inventory, uncollectible receivables.
- Liability Completeness: Are all obligations recorded? Check for off-balance-sheet financing, operating leases (pre-IFRS 16), contingent liabilities.
- Working Capital Management: Aggressive or unusual changes in working capital components may signal earnings manipulation.
- Valuation Assumptions: Review discount rates, useful lives, residual values for reasonableness and consistency.
6.4 Cash Flow Quality
- Operating Cash Flow Quality: Should be positive and stable. Examine components - changes in working capital should not consistently dominate.
- Classification Concerns: Watch for inappropriate classification of cash flows (e.g., capitalizing expenses to move from operating to investing).
- Free Cash Flow: Operating Cash Flow - Capital Expenditures. More relevant for valuation than net income.
- Formula: FCF = CFO - CapEx = Cash available to all investors after maintaining/expanding asset base
6.5 Beneish M-Score Model
The Beneish Model uses eight financial ratios to assess probability of earnings manipulation. M-Score > -2.22 suggests higher manipulation likelihood.
Key Variables:
- DSRI (Days Sales in Receivables Index): Receivables/Sales ratio year-over-year. Increase suggests revenue inflation.
- GMI (Gross Margin Index): Prior year GM / Current year GM. Value > 1 indicates deteriorating margins (negative signal).
- AQI (Asset Quality Index): Proportion of non-current assets other than PP&E. Increase suggests excessive capitalization.
- SGI (Sales Growth Index): Current Sales / Prior Sales. High growth companies face pressure to maintain growth.
- DEPI (Depreciation Index): Depreciation rate comparison. Decrease in depreciation rate may signal manipulation.
6.6 Altman Z-Score Model
Predicts bankruptcy probability for manufacturing firms. Developed by Edward Altman (1968).
Formula: Z = 1.2(X₁) + 1.4(X₂) + 3.3(X₃) + 0.6(X₄) + 1.0(X₅)
Where:
- X₁ = Working Capital / Total Assets (liquidity measure)
- X₂ = Retained Earnings / Total Assets (cumulative profitability)
- X₃ = EBIT / Total Assets (operating efficiency)
- X₄ = Market Value of Equity / Book Value of Total Liabilities (leverage)
- X₅ = Sales / Total Assets (asset turnover)
Interpretation:
- Z > 2.99: Safe zone (low bankruptcy risk)
- 1.81 < z="">< 2.99:="" grey="" zone="" (moderate="">
- Z < 1.81:="" distress="" zone="" (high="" bankruptcy="">
7. Limitations of Financial Statements
Despite their utility, financial statements have inherent limitations that analysts must recognize. Understanding these constraints prevents over-reliance and encourages supplementary analysis.
7.1 Fundamental Limitations
- Historical Nature: Financial statements report past performance and position. They provide limited information about future prospects, though trends offer clues.
- Backward-Looking: Valuations are based on historical cost (for many items), not current market values or replacement costs.
- Periodicity: Artificial division of business operations into reporting periods creates timing mismatches and requires estimates.
- Aggregation: Consolidation of diverse operations into single numbers masks segment-specific performance and risks.
7.2 Measurement and Valuation Issues
- Historical Cost Convention: Many assets recorded at acquisition cost, not fair value. PP&E, inventory (partially) don't reflect current replacement costs.
- Intangible Assets: Internally generated intangibles (brand value, customer relationships, human capital) not recognized unless acquired. Balance sheet understates true economic assets.
- Goodwill Impairment: Subjective impairment testing can delay recognition of economic losses.
- Financial Instruments: Fair value measurements involve significant judgment and estimates, especially for Level 3 inputs (unobservable).
7.3 Estimation and Judgment Issues
- Management Estimates Required: Useful lives, residual values, allowance for doubtful accounts, warranty provisions, contingencies, fair values.
- Subjectivity: Different managers can produce different numbers using same transactions due to judgment differences.
- Earnings Management: Management has incentives to manipulate earnings within GAAP to meet targets, smooth income, or influence stock prices.
- Trap Alert: Just because financial statements comply with GAAP/IFRS doesn't mean they faithfully represent economic reality. Aggressive accounting is often legal but misleading.
7.4 Comparability Limitations
- Accounting Policy Choices: Companies can choose different methods (depreciation methods, inventory costing, revenue recognition timing) within GAAP, hindering comparison.
- IFRS vs US GAAP: International comparisons complicated by different standards.
- Industry Differences: Standard ratios may not be comparable across industries with different business models.
- Changes in Standards: New accounting standards change historical comparability (e.g., IFRS 16 lease capitalization).
7.5 Information Omissions
Important factors not captured in financial statements:
- Future strategy and plans: Management's strategic direction, planned investments, market expansion
- Competitive position: Market share, competitive advantages, barriers to entry
- Management quality: Experience, integrity, track record of capital allocation
- Innovation capacity: R&D pipeline, technological capabilities (R&D expensed immediately)
- Customer satisfaction: Brand loyalty, Net Promoter Scores, customer retention
- Employee morale: Turnover rates, employee engagement, talent retention
- Environmental/social factors: ESG risks and opportunities increasingly material but inconsistently reported
- Macroeconomic conditions: Interest rates, inflation, GDP growth affecting future performance
7.6 Timeliness Issues
- Reporting Lag: Quarterly reports filed 45-60 days after quarter end; annual reports 60-90 days after year end. Information already stale.
- Market Speed: Markets incorporate information rapidly; financial statements often reflect already-known information.
- Event Significance: Major events (management changes, product launches, regulatory actions) may not appear in financial statements immediately.
7.7 Mitigation Strategies
To overcome limitations, analysts should:
- Use multiple information sources (MD&A, conference calls, industry reports, news)
- Make adjustments for accounting differences before comparing companies
- Analyze multiple periods to identify trends and reduce single-period distortions
- Focus on cash flows in addition to accrual-based earnings
- Conduct qualitative analysis of management, strategy, and competitive position
- Apply analytical techniques (ratio analysis, common-size) to extract additional insights
- Consider non-financial metrics (customer acquisition costs, churn rates, same-store sales)
8. Exam-Relevant Practice Questions
8.1 Question 1: IFRS vs US GAAP
Question: A company following IFRS wrote down inventory to net realizable value last year. This year, the net realizable value has increased above the original cost. Under IFRS, what is the appropriate treatment, and how does this differ from US GAAP?
Solution:
Under IFRS, inventory write-downs can be reversed up to the amount of the original write-down if net realizable value increases. The reversal is recognized in profit or loss. However, inventory cannot be written up above original cost.
Under US GAAP, inventory write-downs cannot be reversed once recognized. The written-down value becomes the new cost basis.
Example: Original cost = $100, written down to NRV = $70 last year. This year NRV = $110.
- IFRS: Can reverse write-down by $30 (up to original cost of $100). Inventory recorded at $100.
- US GAAP: No reversal allowed. Inventory remains at $70 until sold.
Key Learning: IFRS allows more flexibility in inventory valuation reflecting current conditions; US GAAP is more conservative once a loss is recognized.
8.2 Question 2: Financial Statement Users
Question: Which financial statement and which specific ratios would be MOST relevant for a bank evaluating a company's loan application?
Solution:
A bank (creditor) is primarily concerned with the company's ability to repay debt obligations and service interest payments.
Most Relevant Financial Statements:
- Statement of Cash Flows - Cash generation from operations is crucial for debt repayment
- Balance Sheet - Evaluates existing leverage, liquidity, and collateral availability
- Income Statement - Assesses earnings stability and interest coverage
Key Ratios:
- Interest Coverage Ratio = EBIT / Interest Expense (measures ability to pay interest; higher is better, typically want > 3×)
- Debt-to-EBITDA Ratio (measures leverage relative to cash-generating ability; lower is better)
- Current Ratio = Current Assets / Current Liabilities (assesses short-term liquidity; typically want > 1.5)
- Debt-to-Equity Ratio = Total Debt / Total Equity (measures financial leverage; lower suggests less risk)
- Cash Flow to Debt Ratio = Operating Cash Flow / Total Debt (indicates debt repayment capacity from operations)
Key Learning: Different users prioritize different statements and metrics based on their decision context. Creditors focus on downside risk and cash generation; equity investors focus on upside potential and profitability.
8.3 Question 3: Quality of Earnings
Question: Company A reports net income of $100 million and operating cash flow of $60 million. Company B reports net income of $80 million and operating cash flow of $95 million. Both companies are in the same industry with similar size. Which company likely has higher earnings quality and why?
Solution:
Company B likely has higher earnings quality.
Analysis:
- Company A: Operating cash flow ($60M) is significantly LOWER than net income ($100M). This suggests:
- Earnings may include significant non-cash accruals
- Working capital is consuming cash (rising receivables/inventory or declining payables)
- Potential aggressive revenue recognition or delayed expense recognition
- Earnings not converting to cash - sustainability concern
- Company B: Operating cash flow ($95M) is HIGHER than net income ($80M). This indicates:
- Strong cash conversion
- Conservative accounting (possibly faster expense recognition)
- Working capital generating cash (efficient collections, inventory management)
- Earnings backed by actual cash - higher sustainability
Cash Flow to Net Income Ratios:
- Company A: 60/100 = 0.60 (concerning - only 60% of earnings converted to cash)
- Company B: 95/80 = 1.19 (strong - generating more cash than reported earnings)
Red Flag: When OCF < net="" income="" persistently,="" investigate="" days="" sales="" outstanding,="" inventory="" turnover,="" and="" capitalization="" policies="" for="" potential="" earnings="">
Key Learning: High-quality earnings should be backed by operating cash flows. Divergence between net income and operating cash flow requires investigation and typically indicates lower earnings quality.
8.4 Question 4: DuPont Analysis
Question: Company X has ROE of 15%. Using three-component DuPont analysis, ROE can be decomposed as: Net Profit Margin = 5%, Total Asset Turnover = 2, Equity Multiplier = 1.5. Company Y also has ROE of 15%, but with: Net Profit Margin = 10%, Total Asset Turnover = 1, Equity Multiplier = 1.5. Compare these companies' performance drivers.
Solution:
DuPont Formula Verification:
- Company X: ROE = 5% × 2 × 1.5 = 15% ✓
- Company Y: ROE = 10% × 1 × 1.5 = 15% ✓
Analysis:
Company X - Efficiency-Driven Model:
- Low Net Profit Margin (5%): Operates on thin margins - possibly low-margin retail or competitive industry
- High Asset Turnover (2×): Generates $2 in sales for every $1 in assets - very efficient asset utilization
- Moderate Leverage (1.5×): Assets = 1.5 × Equity, reasonable debt levels
- Business Model: High-volume, low-margin strategy (e.g., Walmart, discount retailers)
Company Y - Margin-Driven Model:
- High Net Profit Margin (10%): Keeps more profit per dollar of sales - pricing power or differentiation
- Low Asset Turnover (1×): Generates $1 in sales per $1 in assets - asset intensive or slower turnover
- Moderate Leverage (1.5×): Same leverage as Company X
- Business Model: High-margin, lower-volume strategy (e.g., luxury goods, specialized manufacturing)
Investment Implications:
- Company X is vulnerable to volume declines - needs consistent high sales to maintain ROE
- Company Y is vulnerable to margin compression - pricing pressure would directly impact ROE
- Company X likely in more competitive industry with lower barriers to entry
- Company Y likely has stronger competitive moat protecting margins
Key Learning: Same ROE can result from very different business models. DuPont analysis reveals whether returns driven by profitability, efficiency, or leverage. This informs risk assessment and competitive positioning.
8.5 Question 5: Limitations of Financial Statements
Question: A pharmaceutical company spends $500 million annually on R&D developing new drugs. Under current accounting standards, this R&D is expensed immediately. How does this treatment limit the usefulness of financial statements for valuation purposes? What adjustments might an analyst consider?
Solution:
Limitations Created:
- Understated Assets: R&D creates valuable intellectual property (future drugs), but balance sheet shows $0 for internally developed intangibles
- Distorted Earnings: Current period bears full R&D expense, but benefits realized over many future periods when drugs are marketed
- Depressed Profitability Metrics: ROA and profit margins artificially low because:
- Denominator (assets) excludes valuable R&D assets
- Numerator (income) includes full R&D expense immediately
- Comparability Issues: Comparing this company to one that acquires drugs (capitalizes as intangible assets) produces misleading results
- Penalizes Innovation: Companies investing heavily in future growth appear less profitable than those under-investing
Analyst Adjustments (Capitalization Approach):
- Capitalize R&D Expenditures:
- Estimate useful life of R&D (e.g., 5 years for pharmaceutical)
- Capitalize current year R&D: Add $500M to intangible assets
- Amortize previous years' R&D over estimated life
- Adjust Income Statement:
- Remove R&D expense of $500M
- Add back amortization expense (e.g., if capitalizing 5 years of $500M each = $2,500M / 5 = $500M amortization)
- Net effect: Smooths earnings over benefit period
- Adjust Balance Sheet:
- Increase intangible assets by net capitalized R&D (gross - accumulated amortization)
- Increase retained earnings by cumulative effect on net income
- Recalculate Ratios:
- ROA = Adjusted Net Income / Adjusted Total Assets (now includes R&D asset)
- Both numerator and denominator increase, but more accurate representation of economic returns
Example Calculation:
Assuming 5-year capitalization period, in steady state (Year 5+):
- Capitalized R&D Asset = $500M × 5 years = $2,500M on balance sheet
- Annual Amortization = $2,500M / 5 = $500M expense
- Net Income Effect = $0 in steady state (expense removed = amortization added back)
- But total assets increase by $2,500M, providing better denominator for ROA
Additional Considerations:
- Apply probability of success weighting (pharmaceutical R&D has ~10% success rate from Phase I to approval)
- Use discounted future cash flows to estimate fair value of R&D asset
- Monitor R&D productivity metrics: New drug approvals per $ spent, pipeline progression
Key Learning: Financial statements follow rules that may not reflect economic reality. Analysts must make informed adjustments to improve comparability and capture true economic value, especially for knowledge-intensive industries where intangible assets drive value.
9. Critical Memorization Points
9.1 Key Formulas - Must Know
- Accounting Equation: Assets = Liabilities + Equity
- DuPont 3-Component: ROE = Net Profit Margin × Asset Turnover × Equity Multiplier = (NI/Sales) × (Sales/Assets) × (Assets/Equity)
- DuPont 5-Component: ROE = Tax Burden × Interest Burden × EBIT Margin × Asset Turnover × Leverage
- Free Cash Flow: FCF = CFO - CapEx
- Common-Size: Item / Base × 100 (Revenue for IS; Total Assets for BS)
- Horizontal Analysis: [(Current - Base) / Base] × 100
- Altman Z-Score: Z = 1.2X₁ + 1.4X₂ + 3.3X₃ + 0.6X₄ + 1.0X₅ (Z > 2.99 = safe; Z < 1.81="">
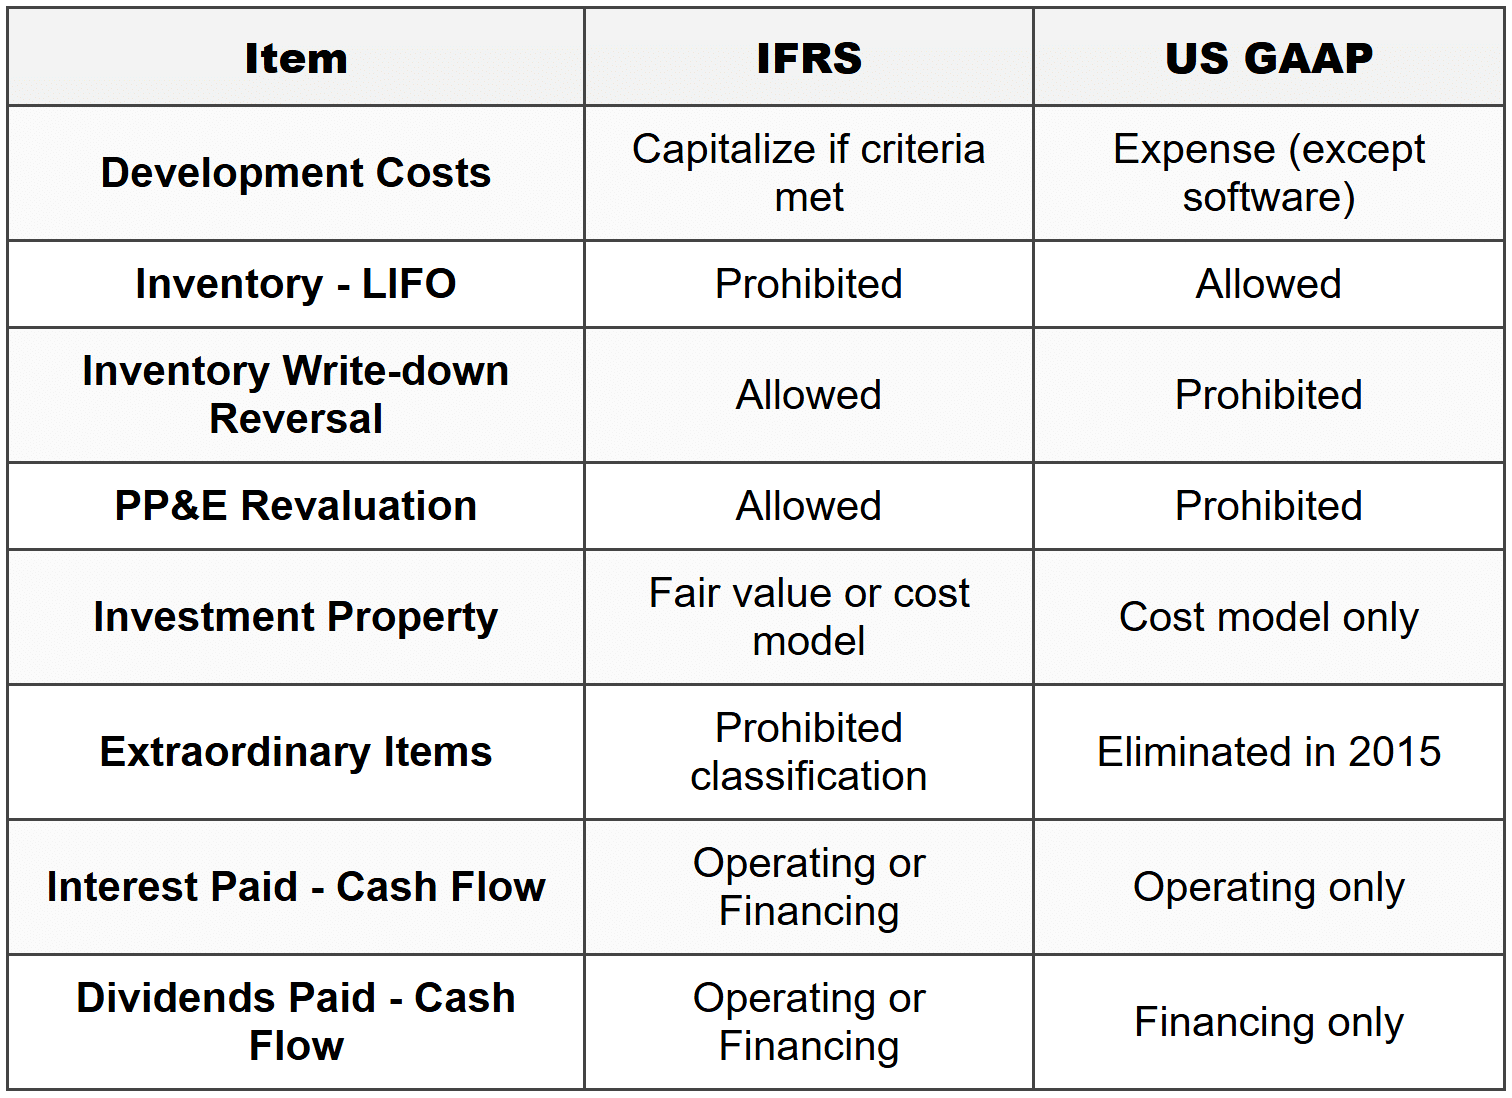
9.2 IFRS vs US GAAP Quick Reference
9.3 Red Flags Checklist - Memorize
- Revenue Quality: DSO increasing, revenue growth exceeding industry, bill-and-hold sales
- Expense Quality: Excessive capitalization, declining depreciation rates, frequent adjustments/one-time items
- Cash Flow Quality: OCF < net="" income="" persistently,="" working="" capital="" consistently="" negative="">
- Balance Sheet Quality: Rising intangibles (especially goodwill), off-balance-sheet obligations, frequent impairments
- Other Flags: Frequent accounting policy changes, auditor changes, related-party transactions, management turnover
9.4 Analytical Framework - Memorize 6 Phases
- State Objective and Context
- Gather Data
- Process Data
- Analyze/Interpret
- Develop and Communicate Conclusions
- Follow-up
9.5 Financial Statement Users - Primary Focus
- Equity Investors: ROE, EPS growth, P/E ratios, dividends, future cash flows
- Creditors: Interest coverage, leverage ratios, operating cash flow, collateral
- Management: All metrics, segment performance, variance from budget
- Analysts: Comprehensive analysis, forecasting, valuation models, peer comparison
Financial statement analysis is a systematic process requiring both technical proficiency and professional judgment. Mastery of accounting standards, analytical techniques, and quality assessment frameworks enables analysts to extract decision-useful information from financial reports. However, recognizing the inherent limitations of financial statements and supplementing analysis with qualitative factors, industry research, and economic context is essential for comprehensive evaluation. Success in this area requires continuous practice applying concepts to real company financial statements and developing pattern recognition for both high-quality reporting and potential red flags.