Cash Flow Statements I


Cash Flow Statements represent one of the three primary financial statements that provide critical insights into a company's liquidity, solvency, and financial flexibility. Unlike the Income Statement (which uses accrual accounting), the Cash Flow Statement tracks actual cash movements, revealing how a company generates and uses cash during a reporting period. For CFA candidates, mastering cash flow analysis is essential as it frequently appears in both quantitative and qualitative questions, particularly in the context of evaluating earnings quality, financial health, and valuation models. This document systematically covers the structure, classification, preparation methods, and interpretation of cash flow statements.
1. Structure and Components of Cash Flow Statement
The Cash Flow Statement is organized into three distinct sections, each revealing different aspects of a company's cash generation and usage patterns.
1.1 Three Primary Sections
- Cash Flow from Operating Activities (CFO): Cash generated or used in the core business operations. This section reflects the cash impact of transactions that determine net income.
- Cash Flow from Investing Activities (CFI): Cash flows related to acquisition and disposal of long-term assets and investments. Typically includes purchases/sales of property, plant, equipment (PP&E), and investment securities.
- Cash Flow from Financing Activities (CFF): Cash flows related to capital structure changes. Includes transactions with owners (equity issuance, dividends, share repurchases) and creditors (debt issuance, debt repayment).
1.2 Standard Format Structure
The statement follows this hierarchical structure:
- Beginning Cash Balance: Cash and cash equivalents at the start of the period
- Net Cash from Operating Activities: Total cash impact from business operations
- Net Cash from Investing Activities: Total cash impact from investment decisions
- Net Cash from Financing Activities: Total cash impact from financing decisions
- Net Change in Cash: Sum of CFO + CFI + CFF
- Ending Cash Balance: Beginning balance + Net change in cash
1.3 Cash and Cash Equivalents Definition
- Cash: Currency on hand, demand deposits, checking accounts
- Cash Equivalents: Short-term, highly liquid investments readily convertible to known amounts of cash with insignificant risk of value change
- Typical Maturity Criterion: Original maturity of three months or less from acquisition date
- Examples of Cash Equivalents: Treasury bills, commercial paper, money market funds
- Exclusions: Marketable securities, bank overdrafts (unless they are integral part of cash management)
2. Cash Flow from Operating Activities (CFO)
CFO represents the cash generated from a company's primary business activities. It is the most important section for assessing sustainable cash generation capability.
2.1 Items Included in Operating Activities
- Cash Inflows: Cash received from customers, interest received, dividends received (under IFRS; US GAAP allows classification flexibility)
- Cash Outflows: Cash paid to suppliers and employees, cash paid for operating expenses, interest paid (under IFRS; US GAAP allows classification flexibility), income taxes paid
- Key Principle: Includes all transactions not classified as investing or financing activities
2.2 Direct Method for CFO Preparation
The Direct Method reports gross cash receipts and payments from operating activities. It provides more transparent information about operating cash flows.
2.2.1 Direct Method Structure
- Cash Received from Customers
- Less: Cash Paid to Suppliers
- Less: Cash Paid to Employees
- Less: Cash Paid for Operating Expenses
- Less: Cash Paid for Interest
- Less: Cash Paid for Income Taxes
- Equals: Net Cash from Operating Activities
2.2.2 Key Conversion Formulas for Direct Method
Cash Received from Customers Formula:
Cash Received from Customers = Revenue + Decrease in Accounts Receivable - Increase in Accounts Receivable
Or: Cash Received = Revenue - ΔAccounts Receivable (where Δ = ending - beginning)
Cash Paid to Suppliers Formula:
Cash Paid to Suppliers = COGS + Increase in Inventory - Decrease in Inventory + Decrease in Accounts Payable - Increase in Accounts Payable
Or: Cash Paid = COGS + ΔInventory - ΔAccounts Payable
Cash Paid for Operating Expenses Formula:
Cash Paid for Operating Expenses = Operating Expenses + Decrease in Prepaid Expenses - Increase in Prepaid Expenses + Decrease in Accrued Liabilities - Increase in Accrued Liabilities
Or: Cash Paid = Operating Expenses - ΔPrepaid Expenses - ΔAccrued Liabilities
Cash Paid for Income Taxes Formula:
Cash Paid for Taxes = Tax Expense + Decrease in Taxes Payable - Increase in Taxes Payable - Increase in Deferred Tax Liability + Decrease in Deferred Tax Liability
2.2.3 Direct Method Advantages and Disadvantages
- Advantages: Provides clear visibility into gross operating cash receipts and payments; easier to understand; preferred by both IFRS and US GAAP (though not required)
- Disadvantages: Requires more detailed data collection; more time-consuming to prepare; companies still must provide reconciliation to net income
- Usage in Practice: Rarely used (less than 1% of companies) despite being recommended by standard-setters
2.3 Indirect Method for CFO Preparation
The Indirect Method starts with net income and adjusts for non-cash items and changes in working capital to arrive at CFO. This is the predominant method used in practice (over 99% of companies).
2.3.1 Indirect Method Structure
The indirect method follows this systematic adjustment process:
- Start with Net Income
- Add back non-cash expenses: Depreciation, amortization, depletion, losses on asset sales, impairment charges
- Subtract non-cash revenues: Gains on asset sales, equity income from associates (add back dividends received)
- Adjust for working capital changes:
2.3.2 Working Capital Adjustment Rules (Critical for Exam)
Changes in Current Assets (excluding cash):
- Increase in Current Assets → Subtract from Net Income (cash used)
- Decrease in Current Assets → Add to Net Income (cash generated)
- Applies to: Accounts Receivable, Inventory, Prepaid Expenses
Changes in Current Liabilities (excluding short-term debt):
- Increase in Current Liabilities → Add to Net Income (cash preserved)
- Decrease in Current Liabilities → Subtract from Net Income (cash used)
- Applies to: Accounts Payable, Accrued Expenses, Taxes Payable, Unearned Revenue
Trap Alert: Students commonly reverse the signs for working capital adjustments. Remember the logic: When Accounts Receivable increases, sales were recorded but cash was not yet collected, so we subtract from net income. When Accounts Payable increases, expenses were recorded but cash was not yet paid, so we add back to net income.
2.3.3 Complete Indirect Method Formula
CFO = Net Income
+ Depreciation & Amortization
+ Losses on Asset Sales (- Gains on Asset Sales)
+ Impairment Charges
- Increase in Accounts Receivable (+ Decrease in A/R)
- Increase in Inventory (+ Decrease in Inventory)
- Increase in Prepaid Expenses (+ Decrease in Prepaid)
+ Increase in Accounts Payable (- Decrease in A/P)
+ Increase in Accrued Liabilities (- Decrease in Accrued Liab.)
+ Increase in Unearned Revenue (- Decrease in Unearned Rev.)
2.3.4 Indirect Method Advantages and Disadvantages
- Advantages: Easier to prepare from available financial data; highlights relationship between net income and CFO; reveals quality of earnings through adjustments
- Disadvantages: Less transparent about actual cash receipts and payments; requires understanding of accrual adjustments
- Reconciliation Requirement: Under IFRS and US GAAP, if direct method is used, companies must still provide indirect method reconciliation
2.4 Special Considerations for Operating Cash Flow
2.4.1 Non-Cash Investing and Financing Activities
- Definition: Significant transactions that do not involve cash but affect asset/liability structure
- Reporting Requirement: Must be disclosed in supplementary schedule or notes (not in main cash flow statement)
- Common Examples: Acquisition of assets through capital lease; conversion of debt to equity; acquisition of assets by issuing stock; exchange of non-cash assets
- Exam Tip: These transactions do NOT appear in the three main sections but must be disclosed separately
3. Cash Flow from Investing Activities (CFI)
CFI reflects cash flows related to acquisition and disposal of long-term assets and investments not classified as cash equivalents.
3.1 Components of Investing Activities
Cash Inflows from Investing:
- Sale of property, plant, and equipment (PP&E)
- Sale of intangible assets
- Sale of investment securities (stocks, bonds held as investments)
- Collection of principal on loans made to other entities
Cash Outflows from Investing:
- Purchase of PP&E (capital expenditures or CapEx)
- Purchase of intangible assets
- Purchase of investment securities
- Loans made to other entities
3.2 Key Formulas for Investing Activities
Cash Paid for PP&E Formula:
Cash Paid for PP&E = Ending PP&E (Gross) - Beginning PP&E (Gross) + Disposals at Cost
Alternative approach using accumulated depreciation:
Cash Paid for PP&E = CapEx (from notes or calculated from changes in PP&E net of depreciation)
Cash Received from PP&E Sale Formula:
Cash Received = Book Value of Asset Sold + Gain on Sale (or - Loss on Sale)
Where: Book Value = Historical Cost - Accumulated Depreciation at time of sale
3.3 Typical CFI Pattern Analysis
- Growing Company: Negative CFI (cash outflows for investments in growth)
- Mature Company: Moderately negative CFI (maintenance CapEx approximately equals depreciation)
- Declining Company: Positive or small negative CFI (selling assets, minimal reinvestment)
- Red Flag: Consistently positive CFI may indicate asset liquidation rather than operational strength
4. Cash Flow from Financing Activities (CFF)
CFF reflects cash flows related to raising and repaying capital from owners and creditors.
4.1 Components of Financing Activities
Cash Inflows from Financing:
- Issuance of common stock
- Issuance of preferred stock
- Issuance of debt (bonds, notes payable, mortgages)
Cash Outflows from Financing:
- Payment of cash dividends
- Repurchase of common stock (treasury stock)
- Repurchase of preferred stock
- Repayment of debt principal (not interest-interest is typically operating)
- Payment of financing costs
4.2 Key Formulas for Financing Activities
Cash Paid for Dividends Formula:
Cash Dividends Paid = Dividends Declared + Beginning Dividends Payable - Ending Dividends Payable
Net Cash from Debt Formula:
Net Cash from Debt = Proceeds from New Debt Issued - Principal Repayments
Net Cash from Equity Formula:
Net Cash from Equity = Proceeds from Stock Issuance - Share Repurchases - Dividends Paid
4.3 Typical CFF Pattern Analysis
- Growing Company: Positive CFF (raising capital for expansion)
- Mature Company: Negative CFF (returning cash to shareholders through dividends and buybacks)
- Financial Health Indicator: Companies with strong CFO can fund operations and return cash to investors (negative CFF from choice, not necessity)
5. Cash Flow Classification Differences: IFRS vs US GAAP
Understanding classification flexibility is critical for exam as it affects comparability between companies and jurisdictions.
5.1 Classification Comparison Table
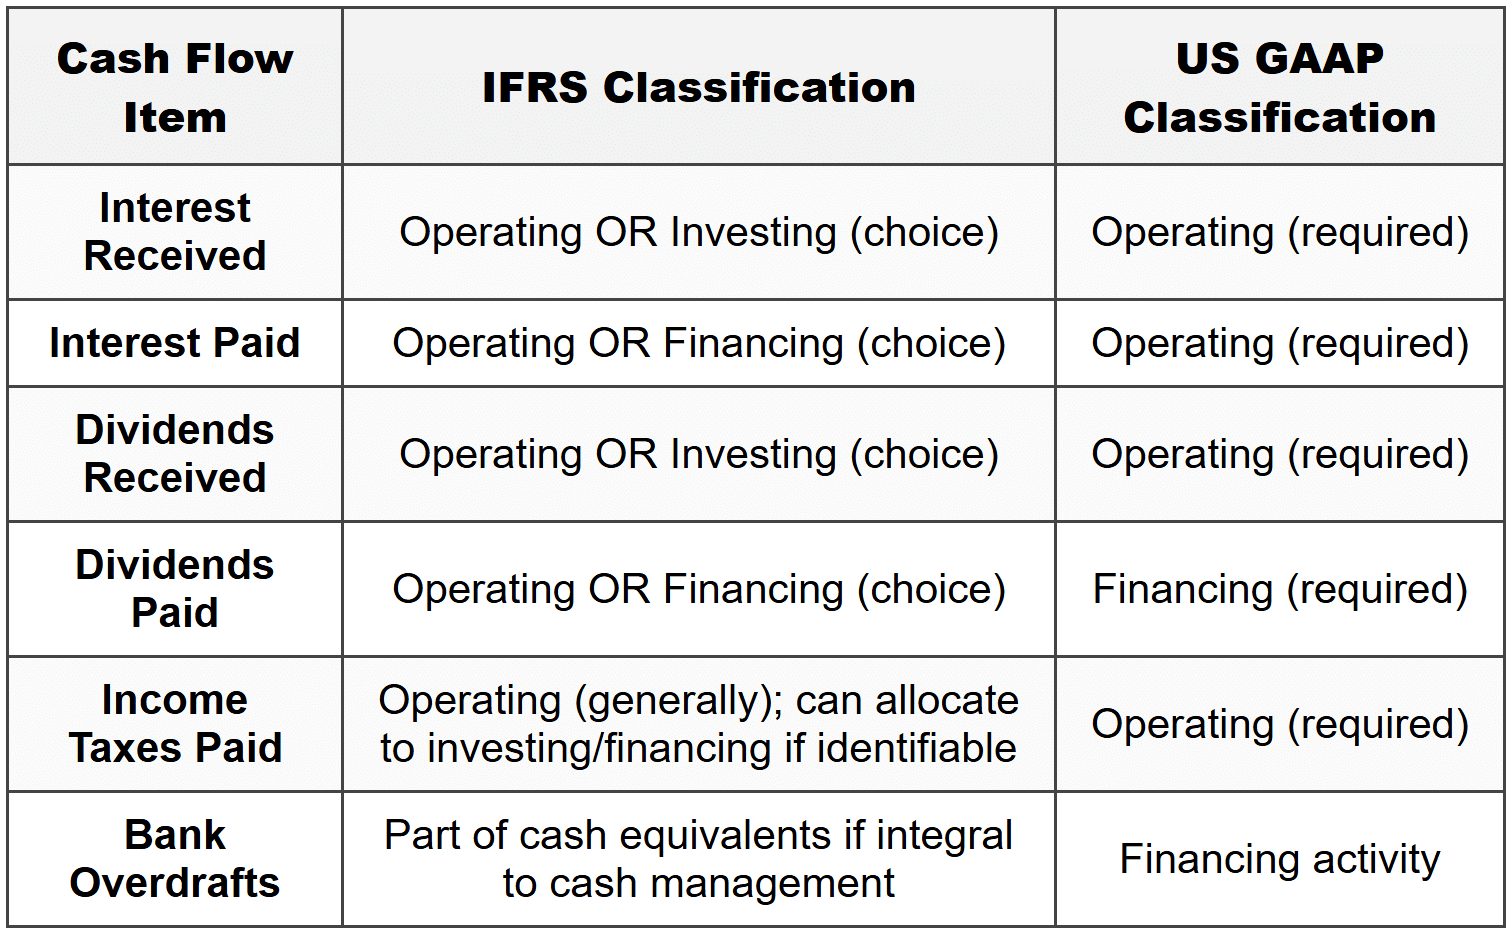
5.2 Impact on Analysis and Comparability
- CFO Manipulation Risk: Under IFRS, companies can classify interest paid as financing (inflates CFO) or interest received as investing (deflates CFO)
- Comparability Challenge: Two similar companies under IFRS may report different CFO due to classification choices
- Analyst Adjustment: For comparability, analysts should reclassify items to a consistent basis before analysis
- Exam Strategy: Always check which standard (IFRS or US GAAP) is specified in the question before solving
5.3 Common Classification Choices and Rationale
- Interest Paid as Financing (IFRS): Rationale-interest is cost of financing, similar to dividends
- Interest Paid as Operating (US GAAP): Rationale-interest is included in net income calculation
- Dividends Received as Investing (IFRS option): Rationale-return on investment activity
- Consistency Requirement: Once a classification choice is made under IFRS, it must be applied consistently
Trap Alert: Students often assume all standards require the same classification. IFRS provides flexibility that US GAAP does not. Always note which standard applies in exam questions.
6. Free Cash Flow and Cash Flow Metrics
Free Cash Flow represents cash available after necessary capital expenditures, crucial for valuation and financial flexibility assessment.
6.1 Free Cash Flow to the Firm (FCFF)
Definition: Cash available to all providers of capital (both debt and equity holders) after operating expenses and capital investments.
FCFF Formula (Starting from CFO):
FCFF = CFO + Interest Expense × (1 - Tax Rate) - Fixed Capital Investment
Where: Fixed Capital Investment = Net CapEx = Capital Expenditures - Proceeds from Asset Sales
FCFF Formula (Starting from Net Income):
FCFF = Net Income + Non-Cash Charges + [Interest Expense × (1 - Tax Rate)] - Fixed Capital Investment - Working Capital Investment
FCFF Formula (Starting from EBIT):
FCFF = EBIT × (1 - Tax Rate) + Depreciation - Fixed Capital Investment - Working Capital Investment
6.2 Free Cash Flow to Equity (FCFE)
Definition: Cash available to equity holders after all expenses, capital investments, and debt obligations.
FCFE Formula (Starting from CFO):
FCFE = CFO - Fixed Capital Investment + Net Borrowing
Where: Net Borrowing = New Debt Issued - Debt Repayments
FCFE Formula (Starting from FCFF):
FCFE = FCFF - Interest Expense × (1 - Tax Rate) + Net Borrowing
FCFE Formula (Starting from Net Income):
FCFE = Net Income + Non-Cash Charges - Fixed Capital Investment - Working Capital Investment + Net Borrowing
6.3 Interpretation of Free Cash Flow
- Positive FCFF/FCFE: Company generates more cash than needed for operations and growth; can pay dividends, reduce debt, or accumulate cash
- Negative FCFF/FCFE: Company needs external financing; may indicate growth phase or financial distress (context dependent)
- FCFE > Dividends Paid: Company has capacity to increase dividends or has unused financial flexibility
- FCFE < dividends=""> Dividends not sustainable from operations; funded by borrowing or asset sales (red flag)
6.4 Cash Flow Performance Ratios
Cash Flow to Revenue Ratio:
CFO to Revenue = CFO ÷ Revenue
- Measures operating cash generation efficiency per dollar of sales
- Higher ratio indicates better cash conversion from sales
Cash Return on Assets:
Cash ROA = CFO ÷ Average Total Assets
- Measures how efficiently assets generate operating cash
- Higher ratio indicates better asset productivity
Cash Return on Equity:
Cash ROE = CFO ÷ Average Shareholders' Equity
- Measures cash generation relative to equity investment
Cash Flow Per Share:
CFO per Share = CFO ÷ Number of Shares Outstanding
- Provides per-share operating cash generation metric
- More reliable than EPS for cross-company comparison
Cash to Income Ratio:
Cash to Income = CFO ÷ Net Income
- Quality of earnings indicator (discussed in detail in Section 8)
- Ratio significantly above 1.0 indicates high earnings quality
7. Comprehensive Conversion Example: Direct to Indirect Method
Understanding the mathematical relationship between methods is essential for exam problem-solving.
7.1 Sample Problem Setup
Given Information:
- Revenue: $500,000
- Cost of Goods Sold: $300,000
- Operating Expenses: $80,000
- Depreciation (included in operating expenses): $20,000
- Interest Expense: $10,000
- Tax Expense: $30,000
- Net Income: $60,000
Balance Sheet Changes:
- Accounts Receivable increased by $15,000
- Inventory increased by $25,000
- Accounts Payable increased by $10,000
- Accrued Expenses decreased by $5,000
7.2 Direct Method Calculation
Step 1: Cash Received from Customers
= Revenue - Increase in Accounts Receivable
= $500,000 - $15,000 = $485,000
Step 2: Cash Paid to Suppliers
= COGS + Increase in Inventory - Increase in Accounts Payable
= $300,000 + $25,000 - $10,000 = $315,000
Step 3: Cash Paid for Operating Expenses
= Operating Expenses - Depreciation + Decrease in Accrued Expenses
= $80,000 - $20,000 + $5,000 = $65,000
Step 4: Cash Paid for Interest
= $10,000 (no adjustment needed-assumed paid in cash)
Step 5: Cash Paid for Taxes
= $30,000 (no adjustment needed-assumed paid in cash)
CFO (Direct Method):
= $485,000 - $315,000 - $65,000 - $10,000 - $30,000 = $65,000
7.3 Indirect Method Calculation
Starting Point: Net Income = $60,000
Adjustments:
- Add: Depreciation = +$20,000 (non-cash expense)
- Subtract: Increase in Accounts Receivable = -$15,000 (cash not collected)
- Subtract: Increase in Inventory = -$25,000 (cash used for inventory buildup)
- Add: Increase in Accounts Payable = +$10,000 (cash preserved)
- Subtract: Decrease in Accrued Expenses = -$5,000 (cash paid reduces liability)
CFO (Indirect Method):
= $60,000 + $20,000 - $15,000 - $25,000 + $10,000 - $5,000 = $65,000
7.4 Verification and Key Insight
Critical Point: Both methods produce identical CFO of $65,000. The direct method shows gross cash flows; the indirect method shows the reconciliation from accrual net income to cash basis.
Exam Strategy: If given both income statement and balance sheet changes, you can solve using either method. Choose the method that requires fewer steps based on the information provided.
8. Quality of Earnings Analysis Through Cash Flow
Earnings quality assessment is a high-frequency exam topic that requires understanding the relationship between accrual-based earnings and cash flows.
8.1 Definition and Importance
Quality of Earnings: The degree to which reported earnings reflect the company's true economic performance and are sustainable, repeatable, and backed by actual cash generation.
High-Quality Earnings Characteristics:
- Supported by strong operating cash flows
- Sustainable and repeatable
- Conservative accounting policies
- Minimal reliance on estimates and judgments
- Low earnings manipulation risk
Low-Quality Earnings Indicators:
- CFO consistently below net income
- Aggressive revenue recognition
- Excessive accruals
- One-time gains inflating earnings
- Deteriorating working capital ratios
8.2 Cash Flow to Net Income Ratio (Primary Quality Metric)
Formula:
Quality of Earnings Ratio = CFO ÷ Net Income
Interpretation Guidelines:
- Ratio > 1.0: High earnings quality; company converts earnings to cash efficiently
- Ratio = 1.0: Earnings match cash generation (neutral quality indicator)
- Ratio <> Warning sign; earnings not fully converted to cash
- Ratio < 0.8=""> Red flag for potential earnings manipulation or business model issues
- Negative CFO with positive net income: Severe quality concern; unsustainable earnings
8.3 Accruals Analysis
Total Accruals Formula:
Total Accruals = Net Income - CFO
Accruals Ratio:
Accruals Ratio = (Net Income - CFO) ÷ Average Total Assets
Interpretation:
- Low or Negative Accruals: High earnings quality (cash exceeds earnings)
- High Positive Accruals: Low earnings quality (earnings significantly exceed cash)
- Extreme Accruals (>10% of assets): Strong warning of potential manipulation
- Trend Analysis: Increasing accruals over time indicate deteriorating earnings quality
8.4 Working Capital Quality Indicators
Days Sales Outstanding (DSO) Trend:
DSO = (Accounts Receivable ÷ Revenue) × 365
- Increasing DSO may indicate aggressive revenue recognition or collection problems
- Compare DSO to industry peers and historical trends
Days Inventory Outstanding (DIO) Trend:
DIO = (Inventory ÷ COGS) × 365
- Increasing DIO may indicate obsolete inventory or overproduction
- Potential future write-downs if inventory builds excessively
Cash Conversion Cycle:
Cash Conversion Cycle = DSO + DIO - Days Payables Outstanding
- Lengthening cycle indicates deteriorating working capital management
- Negative impact on CFO
8.5 Red Flags in Cash Flow Analysis
- Growing Gap Between Net Income and CFO: Indicates increasing reliance on accruals rather than cash generation
- Consistently Negative CFO with Positive Net Income: Business model may not be sustainable; earnings may be manipulated
- CFO from Financing Rather Than Operations: Company borrowing to fund operations rather than generating cash internally
- Large One-Time Items: Frequent "non-recurring" charges suggest poor earnings quality
- Deteriorating CFO Despite Growing Revenue: Revenue growth not translating to cash; may indicate aggressive revenue recognition
- Positive CFI When Company Claims Growth: Selling assets rather than investing suggests financial distress
- Declining CapEx Relative to Depreciation: Under-investing in asset base; future competitive problems
8.6 Earnings Sustainability Assessment
Sustainable Earnings Indicators:
- CFO > Net Income consistently over 3-5 years
- Stable or improving working capital ratios
- CapEx adequate to maintain competitive position (CapEx ≥ Depreciation for mature companies)
- Free cash flow sufficient to cover dividends and debt obligations
- Conservative accounting policy choices
Unsustainable Earnings Indicators:
- Heavy reliance on non-operating gains
- Aggressive capitalization of expenses
- Frequent restatements or changes in accounting estimates
- Operating cash flow declining as percentage of revenue
- Dividend payout ratio exceeds free cash flow generation
9. Common Pitfalls and Exam-Focused Tips
9.1 Frequent Student Errors
- Working Capital Sign Errors: Most common mistake-reversing add/subtract for working capital changes in indirect method
- Forgetting Tax Shield on Interest: In FCFF calculation, must add back interest × (1 - tax rate), not just interest expense
- Confusing CFO Methods: Direct and indirect methods yield same CFO but present information differently
- Misclassifying Non-Cash Transactions: These go in supplementary schedule, not in main cash flow statement sections
- IFRS vs US GAAP Confusion: Not adjusting for classification flexibility under IFRS
- Gain/Loss Treatment: Gains are subtracted from net income in indirect method (already inflated income); losses are added back
9.2 Memory Aids and Mnemonics
For Working Capital Adjustments (Indirect Method):
CARD Principle:
- Current Assets Rise → Deduct from net income
- Current Assets Fall → Add to net income
- Current Liabilities Rise → Add to net income
- Current Liabilities Fall → Deduct from net income
For Classification Under IFRS:
"I DIE" for IFRS flexibility:
- Interest paid → Operating OR Financing
- Dividends paid → Operating OR Financing
- Interest received → Operating OR Investing
- Dividends received → Operating OR Investing (same pattern as interest received)
9.3 Exam Question Pattern Recognition
Type 1: Conversion Problems
- Given: Income statement and balance sheet changes
- Required: Calculate CFO using indirect method or specific components using direct method
- Strategy: Systematically apply adjustment rules; double-check signs
Type 2: Classification Questions
- Given: List of transactions
- Required: Classify each as operating, investing, or financing (may specify IFRS or US GAAP)
- Strategy: Memorize classification rules; note IFRS flexibility
Type 3: Free Cash Flow Calculations
- Given: Cash flow statement components
- Required: Calculate FCFF or FCFE
- Strategy: Know all formula variations; remember tax shield on interest
Type 4: Quality of Earnings Analysis
- Given: Multi-year financial data
- Required: Assess earnings quality and identify red flags
- Strategy: Calculate CFO/NI ratio; analyze trends; look for accruals patterns
Type 5: Analytical Comparison
- Given: Cash flow statements for two companies
- Required: Compare financial health, growth prospects, or accounting quality
- Strategy: Calculate ratios; assess patterns (CFO, CFI, CFF); identify differences in classification
10. Practice Problems with Detailed Solutions
10.1 Problem 1: Indirect Method CFO Calculation
Question: ABC Company reports the following information for 2023:
- Net Income: $150,000
- Depreciation Expense: $40,000
- Gain on Sale of Equipment: $12,000
- Increase in Accounts Receivable: $20,000
- Decrease in Inventory: $15,000
- Increase in Accounts Payable: $8,000
- Decrease in Wages Payable: $5,000
Calculate Cash Flow from Operating Activities using the indirect method.
Solution:
CFO = Net Income + Adjustments
= $150,000
+ Depreciation: +$40,000 (non-cash expense added back)
- Gain on Sale: -$12,000 (non-operating gain removed; cash from sale is in CFI)
- Increase in A/R: -$20,000 (sales made but cash not collected)
+ Decrease in Inventory: +$15,000 (less cash used in inventory)
+ Increase in A/P: +$8,000 (expenses incurred but not yet paid)
- Decrease in Wages Payable: -$5,000 (cash used to pay down liability)
CFO = $150,000 + $40,000 - $12,000 - $20,000 + $15,000 + $8,000 - $5,000 = $176,000
Key Learning Point: Gains are subtracted because they inflate net income but the actual cash received appears in investing activities. The gain amount ($12,000) already increased net income, so we remove it to avoid double-counting.
10.2 Problem 2: Direct Method Component Calculation
Question: XYZ Corporation has the following information:
- Revenue: $800,000
- Beginning Accounts Receivable: $95,000
- Ending Accounts Receivable: $115,000
Calculate cash received from customers.
Solution:
Cash Received from Customers = Revenue - Increase in Accounts Receivable
Increase in A/R = $115,000 - $95,000 = $20,000
Cash Received = $800,000 - $20,000 = $780,000
Alternative Approach (T-account method):
Beginning A/R: $95,000
+ Revenue (credit sales): $800,000
- Cash Collected: X
= Ending A/R: $115,000
Solving: $95,000 + $800,000 - X = $115,000
X = $780,000
Key Learning Point: An increase in accounts receivable means revenue was recognized but cash was not yet collected, so we subtract the increase from revenue to get actual cash collected.
10.3 Problem 3: Free Cash Flow to Equity
Question: LMN Inc. provides the following data:
- Cash Flow from Operations: $500,000
- Capital Expenditures: $200,000
- Proceeds from Sale of Equipment: $30,000
- Debt Issued: $100,000
- Debt Repaid: $75,000
Calculate Free Cash Flow to Equity (FCFE).
Solution:
FCFE = CFO - Net Capital Expenditures + Net Borrowing
Net Capital Expenditures = Capital Expenditures - Proceeds from Asset Sales
= $200,000 - $30,000 = $170,000
Net Borrowing = Debt Issued - Debt Repaid
= $100,000 - $75,000 = $25,000
FCFE = $500,000 - $170,000 + $25,000 = $355,000
Key Learning Point: FCFE represents cash available to equity holders after all capital investments and debt obligations. Positive FCFE indicates the company can pay dividends or repurchase shares without impairing operations.
10.4 Problem 4: Quality of Earnings Assessment
Question: Compare the earnings quality of Company A and Company B:
- Company A: Net Income = $200,000; CFO = $240,000
- Company B: Net Income = $200,000; CFO = $150,000
Which company has higher earnings quality? Explain.
Solution:
Company A:
Quality Ratio = CFO ÷ Net Income = $240,000 ÷ $200,000 = 1.20
Company B:
Quality Ratio = CFO ÷ Net Income = $150,000 ÷ $200,000 = 0.75
Analysis:
- Company A has higher earnings quality with a ratio of 1.20 > 1.0, indicating it converts more than 100% of earnings into operating cash flow
- Company B's ratio of 0.75 < 1.0="" suggests="" only="" 75%="" of="" earnings="" are="" backed="" by="" cash;="" the="" remaining="" 25%="" consists="" of="" accruals="" that="" may="" not="" materialize="" into="">
- Company A's earnings are more sustainable and reliable
- Company B may be using aggressive accounting policies or experiencing working capital deterioration
Key Learning Point: A CFO/Net Income ratio above 1.0 is a strong positive signal. Ratios persistently below 0.8 warrant investigation into accruals, revenue recognition policies, and working capital management.
10.5 Problem 5: IFRS vs US GAAP Classification
Question: DEF Corporation (reporting under IFRS) pays $50,000 in interest and receives $10,000 in dividends. The company classifies interest paid as a financing activity and dividends received as an investing activity. How would these classifications differ under US GAAP, and what is the impact on CFO?
Solution:
Under IFRS (as chosen by DEF):
- Interest Paid ($50,000): Classified as CFF
- Dividends Received ($10,000): Classified as CFI
- Impact on CFO: $0 (neither item affects CFO)
Under US GAAP (required classification):
- Interest Paid ($50,000): Must be classified as CFO (outflow)
- Dividends Received ($10,000): Must be classified as CFO (inflow)
- Impact on CFO: -$50,000 + $10,000 = -$40,000 (net reduction to CFO)
Comparability Adjustment:
If comparing DEF (IFRS) to a US GAAP company, analyst should reclassify:
- DEF's CFO (adjusted) = CFO (reported) - $50,000 + $10,000
- DEF's CFF (adjusted) = CFF (reported) + $50,000
- DEF's CFI (adjusted) = CFI (reported) - $10,000
Key Learning Point: IFRS allows companies to inflate CFO by classifying interest paid as financing and deflate CFO by classifying dividends received as investing. Analysts must reclassify for meaningful comparison. This is a frequent exam trap-always check which standard applies.
10.6 Problem 6: Comprehensive Cash Flow Statement Construction
Question: GHI Company provides the following information for the year ended December 31, 2023:
- Net Income: $180,000
- Depreciation: $45,000
- Loss on Sale of Investments: $8,000
- Increase in Accounts Receivable: $12,000
- Decrease in Inventory: $18,000
- Increase in Prepaid Expenses: $4,000
- Increase in Accounts Payable: $10,000
- Decrease in Accrued Liabilities: $6,000
- Purchase of Equipment: $100,000
- Sale of Investments (book value $40,000): $32,000
- Issuance of Common Stock: $75,000
- Payment of Dividends: $50,000
- Repayment of Long-term Debt: $30,000
- Beginning Cash: $65,000
Prepare a complete Cash Flow Statement.
Solution:
Cash Flow from Operating Activities (Indirect Method):
Net Income: $180,000
Adjustments:
+ Depreciation: $45,000
+ Loss on Sale of Investments: $8,000 (non-operating loss added back)
- Increase in Accounts Receivable: -$12,000
+ Decrease in Inventory: $18,000
- Increase in Prepaid Expenses: -$4,000
+ Increase in Accounts Payable: $10,000
- Decrease in Accrued Liabilities: -$6,000
Net Cash from Operating Activities: $239,000
Cash Flow from Investing Activities:
- Purchase of Equipment: -$100,000
+ Proceeds from Sale of Investments: $32,000
Net Cash from Investing Activities: -$68,000
Cash Flow from Financing Activities:
+ Issuance of Common Stock: $75,000
- Payment of Dividends: -$50,000
- Repayment of Long-term Debt: -$30,000
Net Cash from Financing Activities: -$5,000
Net Change in Cash:
= $239,000 - $68,000 - $5,000 = $166,000
Ending Cash Balance:
= Beginning Cash + Net Change in Cash
= $65,000 + $166,000 = $231,000
Verification:
- Total sources of cash: $180,000 (NI) + $45,000 (dep) + $8,000 (loss) + $18,000 (inv dec) + $10,000 (AP inc) + $32,000 (inv sale) + $75,000 (stock) = $368,000
- Total uses of cash: $12,000 (AR) + $4,000 (prepaid) + $6,000 (accr liab) + $100,000 (equip) + $50,000 (div) + $30,000 (debt) = $202,000
- Net change: $368,000 - $202,000 = $166,000 ✓
Key Learning Points:
- Loss on sale of investments is added back to net income (it reduced income but the actual cash received is shown in CFI)
- Strong positive CFO ($239,000) indicates healthy core operations
- Negative CFI (-$68,000) due to net investment activity-normal for growing company
- Small negative CFF (-$5,000) shows company returning cash to investors while maintaining capital structure
- Overall strong cash generation with cash increasing by $166,000
11. Key Formulas Summary Sheet
11.1 Operating Cash Flow Formulas
Indirect Method Core Formula:
CFO = Net Income + Non-Cash Expenses - Non-Cash Revenues - Increase in Current Assets (excl. cash) + Decrease in Current Assets + Increase in Current Liabilities (excl. debt) - Decrease in Current Liabilities
Direct Method Components:
- Cash from Customers = Revenue - ΔAccounts Receivable
- Cash to Suppliers = COGS + ΔInventory - ΔAccounts Payable
- Cash for Operating Expenses = Op Expenses - ΔPrepaid - ΔAccrued Liabilities - Depreciation
11.2 Free Cash Flow Formulas
FCFF (from CFO):
FCFF = CFO + Interest × (1 - Tax Rate) - Net CapEx
FCFF (from Net Income):
FCFF = NI + NCC + Int × (1 - t) - FCInv - WCInv
FCFE (from CFO):
FCFE = CFO - Net CapEx + Net Borrowing
FCFE (from FCFF):
FCFE = FCFF - Int × (1 - t) + Net Borrowing
Where: NCC = Non-Cash Charges; FCInv = Fixed Capital Investment; WCInv = Working Capital Investment
11.3 Quality of Earnings Formulas
Quality Ratio:
Quality of Earnings = CFO ÷ Net Income (target: > 1.0)
Accruals:
Total Accruals = Net Income - CFO
Accruals Ratio:
Accruals Ratio = (NI - CFO) ÷ Average Total Assets
11.4 Performance Ratios
Cash Flow Margins:
- CFO Margin = CFO ÷ Revenue
- FCFF Margin = FCFF ÷ Revenue
Cash Returns:
- Cash ROA = CFO ÷ Average Total Assets
- Cash ROE = CFO ÷ Average Shareholders' Equity
Coverage Ratios:
- Debt Coverage = CFO ÷ Total Debt
- Interest Coverage (cash basis) = (CFO + Interest Paid + Taxes Paid) ÷ Interest Paid
- Dividend Coverage = FCFE ÷ Dividends Paid
12. Final Exam Strategy and High-Yield Points
12.1 Must-Memorize for Exam Day
- Three sections order: CFO, CFI, CFF
- Working capital rule: Current asset increase → subtract; Current liability increase → add
- IFRS flexibility: Interest and dividends can be reclassified; US GAAP is rigid
- FCFF vs FCFE: FCFF for all capital providers; FCFE for equity holders only
- Quality threshold: CFO/NI should be ≥ 1.0 for high-quality earnings
- Depreciation treatment: Always added back in indirect method (non-cash expense)
- Gains and losses: Gains subtracted, losses added in indirect method
- Non-cash transactions: Disclosed separately, not in main statement
12.2 Time Management Tips
- Identify method first: Is it direct or indirect? Adjust approach accordingly
- Check standards: Note if IFRS or US GAAP applies before solving classification questions
- Use T-accounts: For complex direct method calculations, quick T-account sketches prevent errors
- Verify signs: Double-check whether you're adding or subtracting working capital changes
- Calculate systematically: Follow the format structure strictly to avoid missing items
12.3 Common Exam Question Stems
- "Calculate cash flow from operating activities using the indirect method..."
- "Determine cash received from customers..."
- "Which classification is correct under IFRS/US GAAP..."
- "Calculate free cash flow to equity..."
- "Assess the quality of earnings for Company X..."
- "What effect would the following transaction have on CFO..."
- "Compare the financial flexibility of Company A and Company B..."
12.4 Integration with Other Topics
- Financial Statement Analysis: Use cash flow metrics alongside profitability and solvency ratios
- Equity Valuation: FCFF and FCFE are inputs for discounted cash flow models
- Corporate Finance: Cash flow analysis informs capital budgeting and working capital management decisions
- Financial Reporting Quality: Cash flow analysis is primary tool for detecting earnings manipulation
Mastering cash flow statement analysis requires understanding both mechanical preparation techniques and interpretive frameworks. The ability to construct cash flow statements using both direct and indirect methods, classify transactions correctly under different accounting standards, calculate free cash flow metrics, and assess earnings quality through cash flow analysis forms the foundation for advanced financial analysis. Regular practice with diverse problem types, attention to classification nuances between IFRS and US GAAP, and systematic application of adjustment rules will ensure exam success. Remember that cash flow analysis goes beyond mere calculation-it provides crucial insights into a company's true financial health, sustainability of earnings, and long-term viability that accrual-based statements alone cannot reveal.