Analysis of Long-Term Assets


Long-term assets represent significant capital investments on a company's balance sheet, typically exceeding one year in useful life. These assets include tangible property, plant, and equipment (PP&E) as well as intangible assets like patents and goodwill. For CFA candidates, understanding the accounting treatment, measurement, and analysis of long-term assets is critical because management's choices regarding capitalization, depreciation, and impairment directly impact financial ratios, profitability metrics, and valuation. This topic tests your ability to analyze financial statements, adjust reported numbers, and assess asset utilization efficiency.
1. Property, Plant, and Equipment (PP&E)
PP&E consists of tangible, long-lived assets used in operations to generate revenue. These assets are initially recorded at historical cost, which includes all expenditures necessary to prepare the asset for its intended use.
1.1 Initial Recognition and Measurement
Capitalizable costs include all expenditures required to bring the asset to working condition:
- Purchase price: Invoice price minus trade discounts plus non-refundable taxes
- Delivery and handling costs: Freight, insurance during transit, import duties
- Site preparation costs: Demolition of old structures, land clearing, grading
- Installation and assembly: Labor, materials, testing costs to make asset operational
- Professional fees: Legal fees, engineering costs, architect fees directly attributable
Basket Purchase Allocation: When multiple assets are purchased together for a lump sum, allocate total cost based on relative fair values:
Formula: Allocated Cost = (Individual Fair Value / Total Fair Value) × Total Purchase Price
Example: Company buys land and building together for $1,200,000. Fair values: Land $400,000, Building $800,000. Land allocation = ($400,000 / $1,200,000) × $1,200,000 = $400,000.
1.2 Borrowing Costs (Interest Capitalization)
Under both IFRS (IAS 23) and US GAAP, interest costs on funds borrowed to finance construction of qualifying assets must be capitalized during the construction period.
- Qualifying asset: Asset requiring substantial time to prepare for intended use (typically >1 year)
- Capitalization period: Begins when expenditures are incurred, borrowing costs are incurred, and activities necessary to prepare the asset are in progress
- Capitalization ends: When substantially all activities necessary to prepare the asset are complete
Formula - Avoidable Interest (Amount to Capitalize):
Avoidable Interest = (Weighted Average Accumulated Expenditures) × (Appropriate Interest Rate)
Where:
- Weighted Average Accumulated Expenditures: Construction expenditures weighted by time outstanding during period
- Appropriate Interest Rate: Rate on specific borrowings or weighted average rate on general borrowings
- Cap: Actual interest incurred during period (cannot capitalize more than actual interest)
Impact: Capitalization increases PP&E and reduces interest expense, thereby increasing net income and equity in construction period. Depreciation in subsequent periods will be higher.
1.3 Measurement Models After Acquisition
Companies can choose between two models for subsequent measurement of PP&E:
- Cost Model (US GAAP and IFRS): Carrying value = Historical Cost - Accumulated Depreciation - Impairment Losses. Most commonly used, provides conservative and verifiable values.
- Revaluation Model (IFRS only): Assets carried at fair value at revaluation date minus subsequent accumulated depreciation and impairment. Increases/decreases bypass income statement and go to revaluation surplus in equity (OCI), except decreases below original cost go to P&L.
Trap Alert: Under revaluation model, the entire class of assets must be revalued (e.g., all buildings), not just selected assets. Revaluations must be kept sufficiently current.
2. Depreciation Methods
Depreciation is the systematic allocation of a depreciable asset's cost over its useful life. It does not represent a decline in market value but rather the matching of asset cost with revenue generation.
2.1 Key Depreciation Components
- Depreciable Cost (Base): Historical Cost - Salvage (Residual) Value
- Salvage Value: Estimated amount recoverable at end of useful life
- Useful Life: Period over which asset is expected to be used (determined by management judgment)
- Depreciable Amount: The portion of cost allocated over useful life
Critical Formula: Depreciable Cost = Cost - Salvage Value
2.2 Straight-Line Method
Allocates equal depreciation expense each year. Most common method globally.
Formula: Annual Depreciation Expense = (Cost - Salvage Value) / Useful Life
Example: Machine costs $100,000, salvage value $10,000, useful life 5 years. Annual depreciation = ($100,000 - $10,000) / 5 = $18,000 per year.
Characteristics:
- Simplest and most widely used method
- Results in constant expense, highest net income in early years compared to accelerated methods
- Appropriate when asset provides equal benefits each period
2.3 Declining Balance Method (Accelerated)
Applies a constant rate to the declining book value each period. Double-Declining Balance (DDB) is most common, using 2 × straight-line rate.
Formula: Depreciation Expense = Book Value at Beginning of Year × (2 / Useful Life)
Where:
- Depreciation Rate: 2 / Useful Life (for DDB)
- Book Value: Cost - Accumulated Depreciation
- Note: Salvage value is NOT subtracted in calculation but acts as floor (cannot depreciate below salvage value)
Example: Machine costs $100,000, salvage value $10,000, useful life 5 years. DDB rate = 2/5 = 40%.
- Year 1: $100,000 × 40% = $40,000
- Year 2: ($100,000 - $40,000) × 40% = $24,000
- Year 3: ($60,000 - $24,000) × 40% = $14,400
- Continue until book value reaches salvage value
Characteristics:
- Higher depreciation in early years, lower in later years
- Results in lower net income and equity initially
- Appropriate when asset loses value faster early in life or provides greater benefits initially
2.4 Units-of-Production Method
Depreciation based on actual usage or output rather than time passage.
Formula: Depreciation Expense = [(Cost - Salvage Value) / Total Estimated Units] × Units Produced in Period
Example: Machine costs $100,000, salvage value $10,000, expected to produce 450,000 units. In Year 1, produces 90,000 units.
Year 1 depreciation = [($100,000 - $10,000) / 450,000] × 90,000 = $0.20 × 90,000 = $18,000
Characteristics:
- Variable expense based on production levels
- Most appropriate for manufacturing equipment, natural resources (called depletion for extraction)
- Better matching of expense with revenue generation
2.5 Component Depreciation (IFRS Requirement)
When significant parts of PP&E have different useful lives, each component must be depreciated separately.
Example: Aircraft body (25 years) vs. engines (10 years) vs. interior (5 years) must each be depreciated over respective lives.
Trap Alert: Component depreciation is required under IFRS but only permitted under US GAAP. This increases depreciation expense initially if shorter-lived components are significant.
2.6 Financial Statement Impact of Depreciation Method Choice
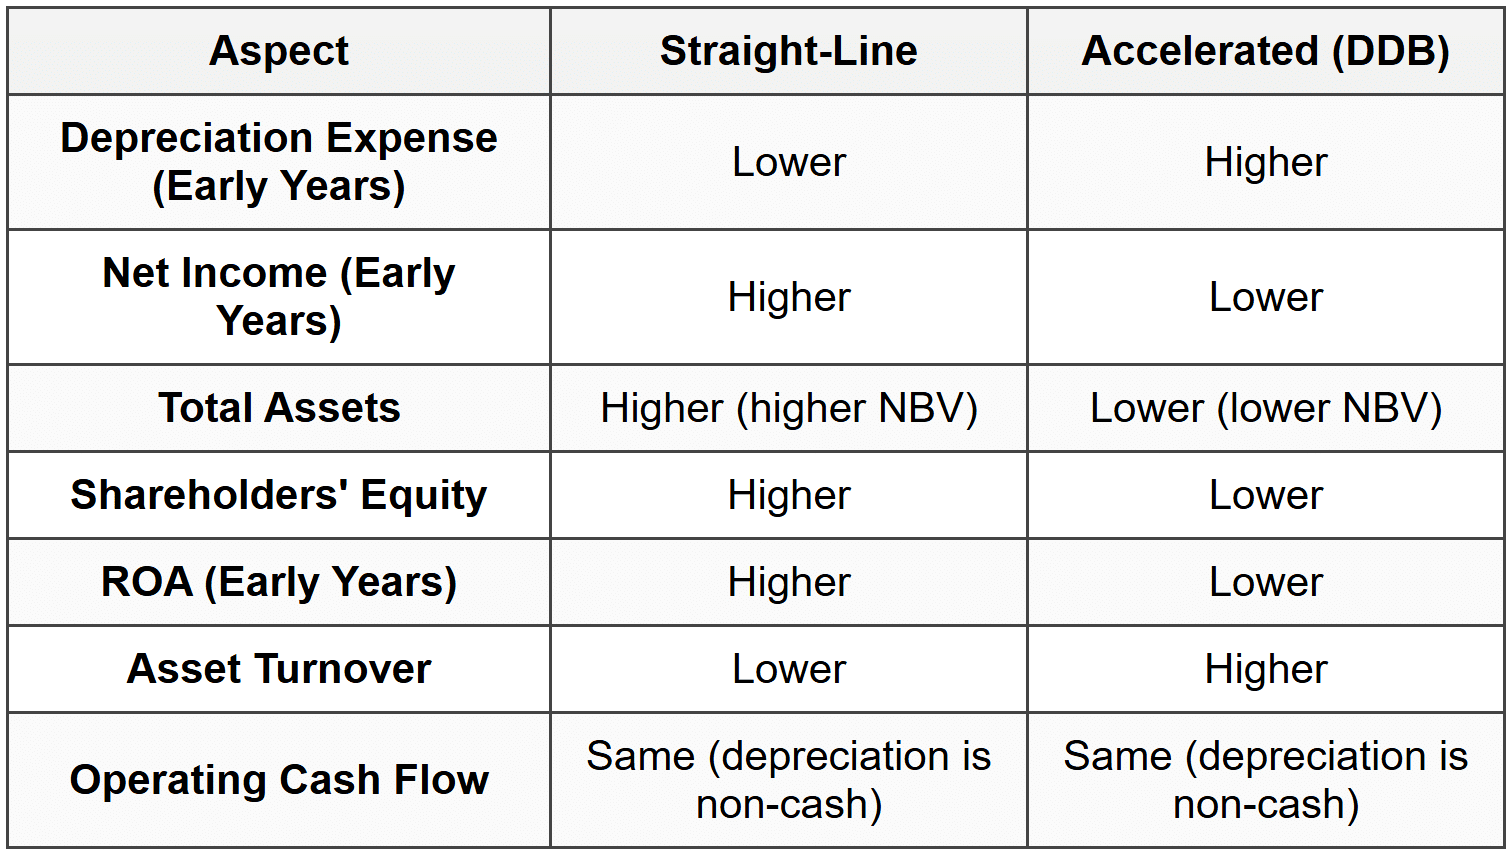
Key Insight: Over the asset's entire life, total depreciation expense is identical under all methods (Cost - Salvage Value). Only the timing differs, affecting period-to-period comparisons.
3. Capitalization vs. Expensing Decision
The choice to capitalize or expense an expenditure significantly impacts financial statements. Understanding management discretion and accounting standards is crucial for analysis.
3.1 Fundamental Distinction
- Capitalize: Record expenditure as asset on balance sheet, then depreciate/amortize over useful life. Benefits extend beyond current period.
- Expense: Record entire expenditure as expense on income statement in current period. Benefits consumed immediately.
3.2 Criteria for Capitalization
An expenditure should be capitalized if it meets all of the following conditions:
- Future economic benefits: Probable that future economic benefits will flow to entity
- Reliable measurement: Cost can be measured reliably
- Enhancement: Improves asset beyond original condition (increases capacity, efficiency, or useful life)
3.3 Expenditure Types
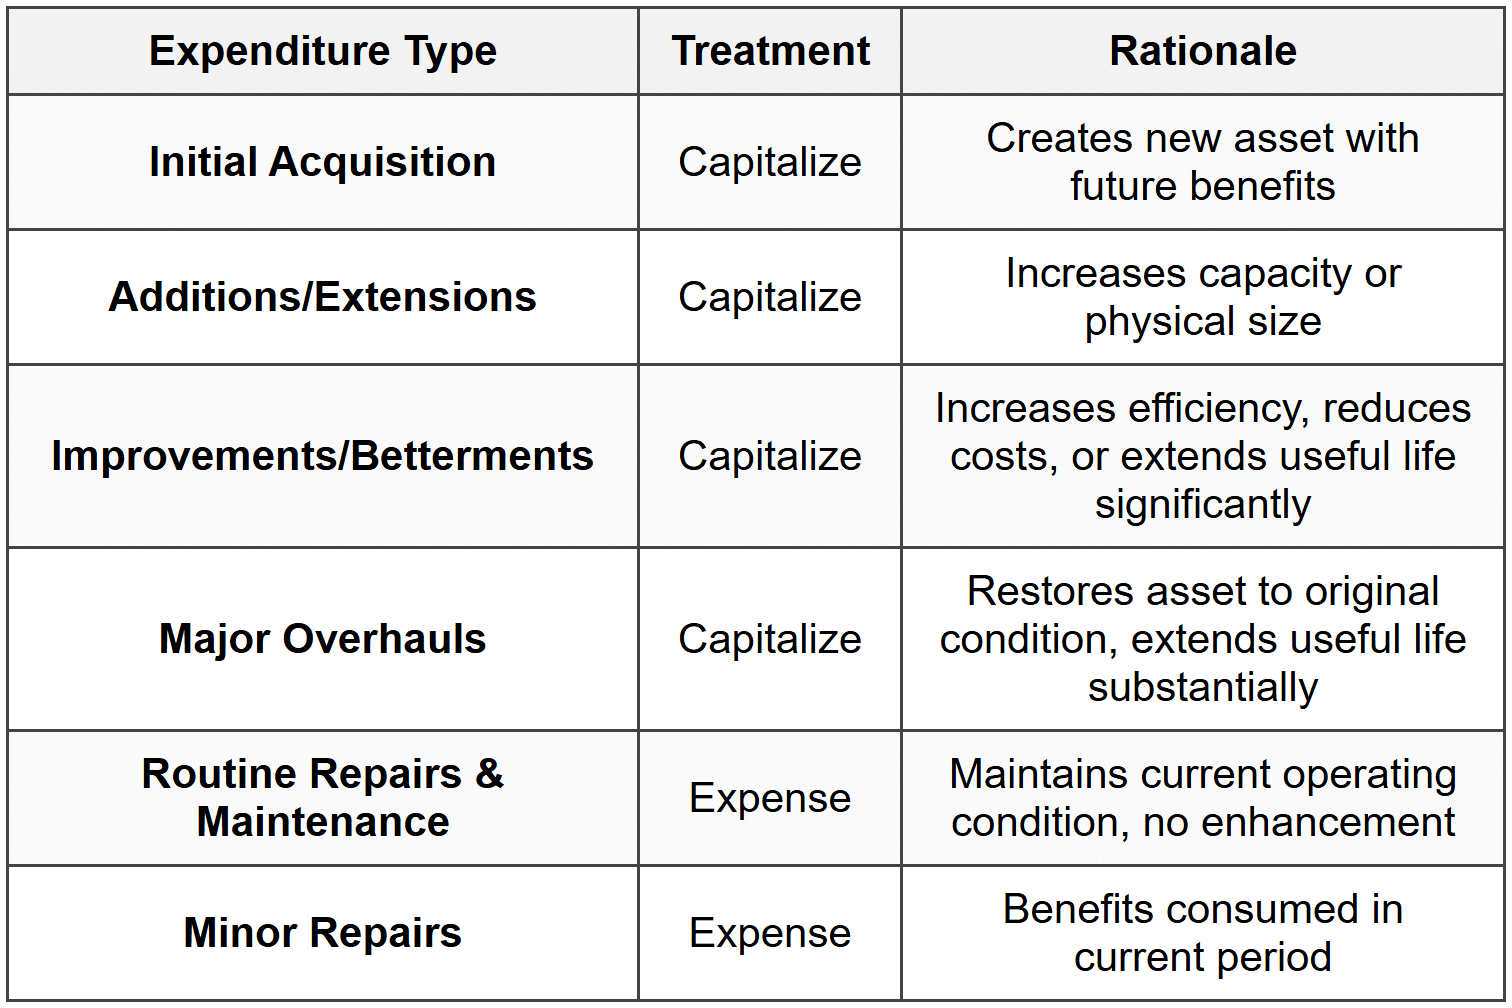
3.4 Financial Statement Impact Analysis
In the Year of Expenditure:
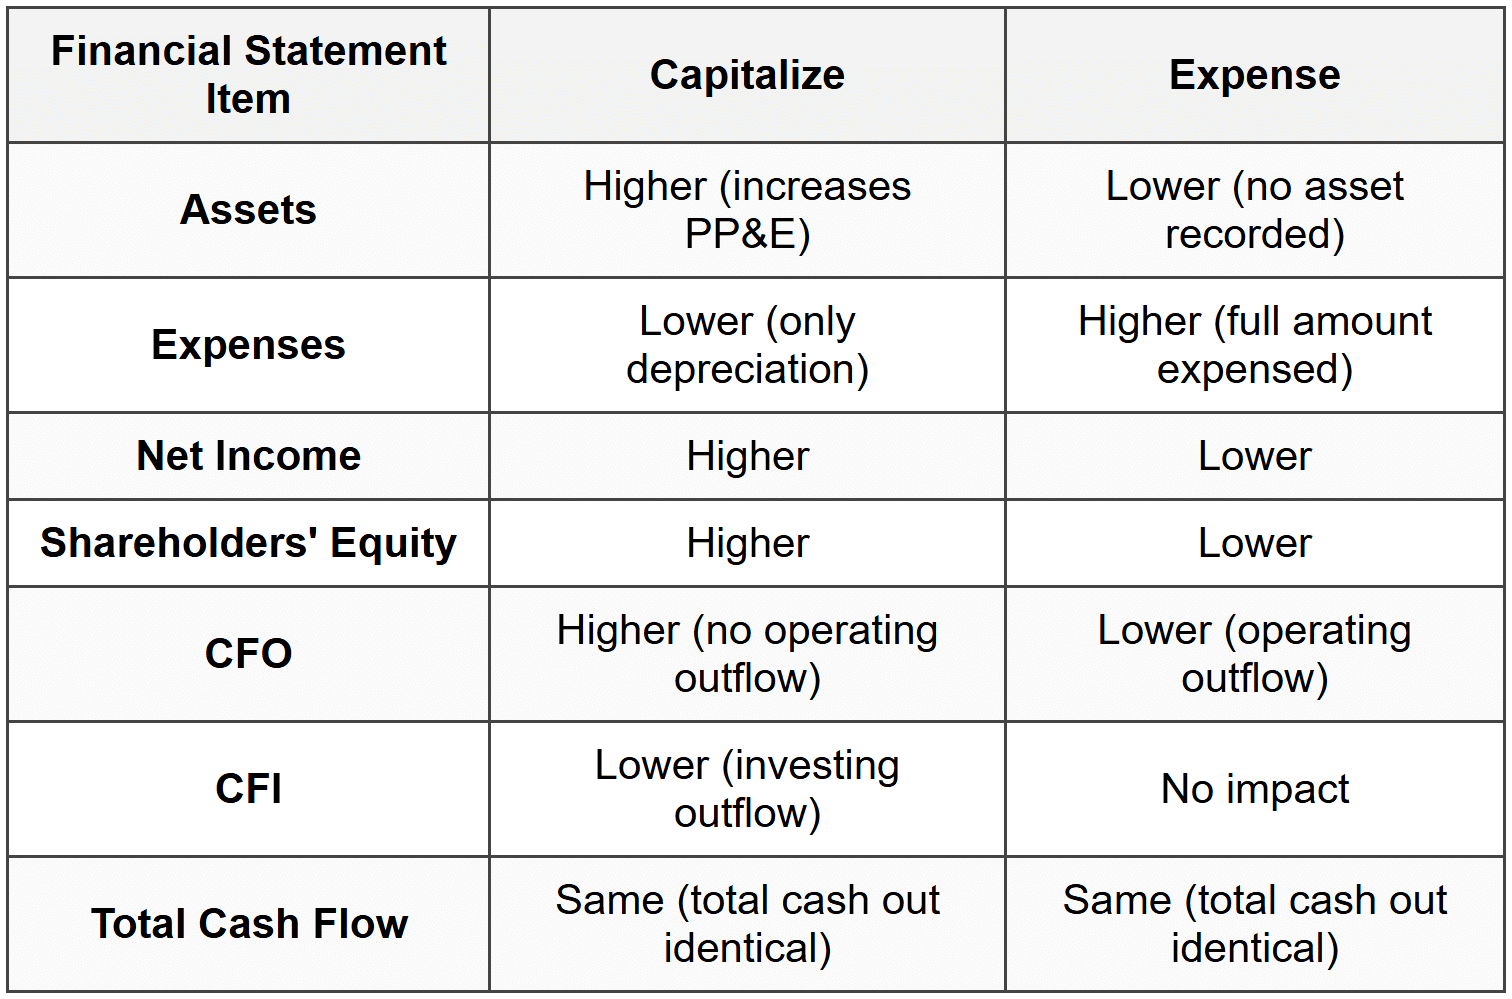
In Subsequent Years:
- Capitalized: Depreciation expense reduces net income gradually; assets decline due to accumulated depreciation
- Expensed: No further impact on financial statements
3.5 Ratio Impact - Capitalization vs. Expensing
In Year of Expenditure (assuming same expenditure amount):
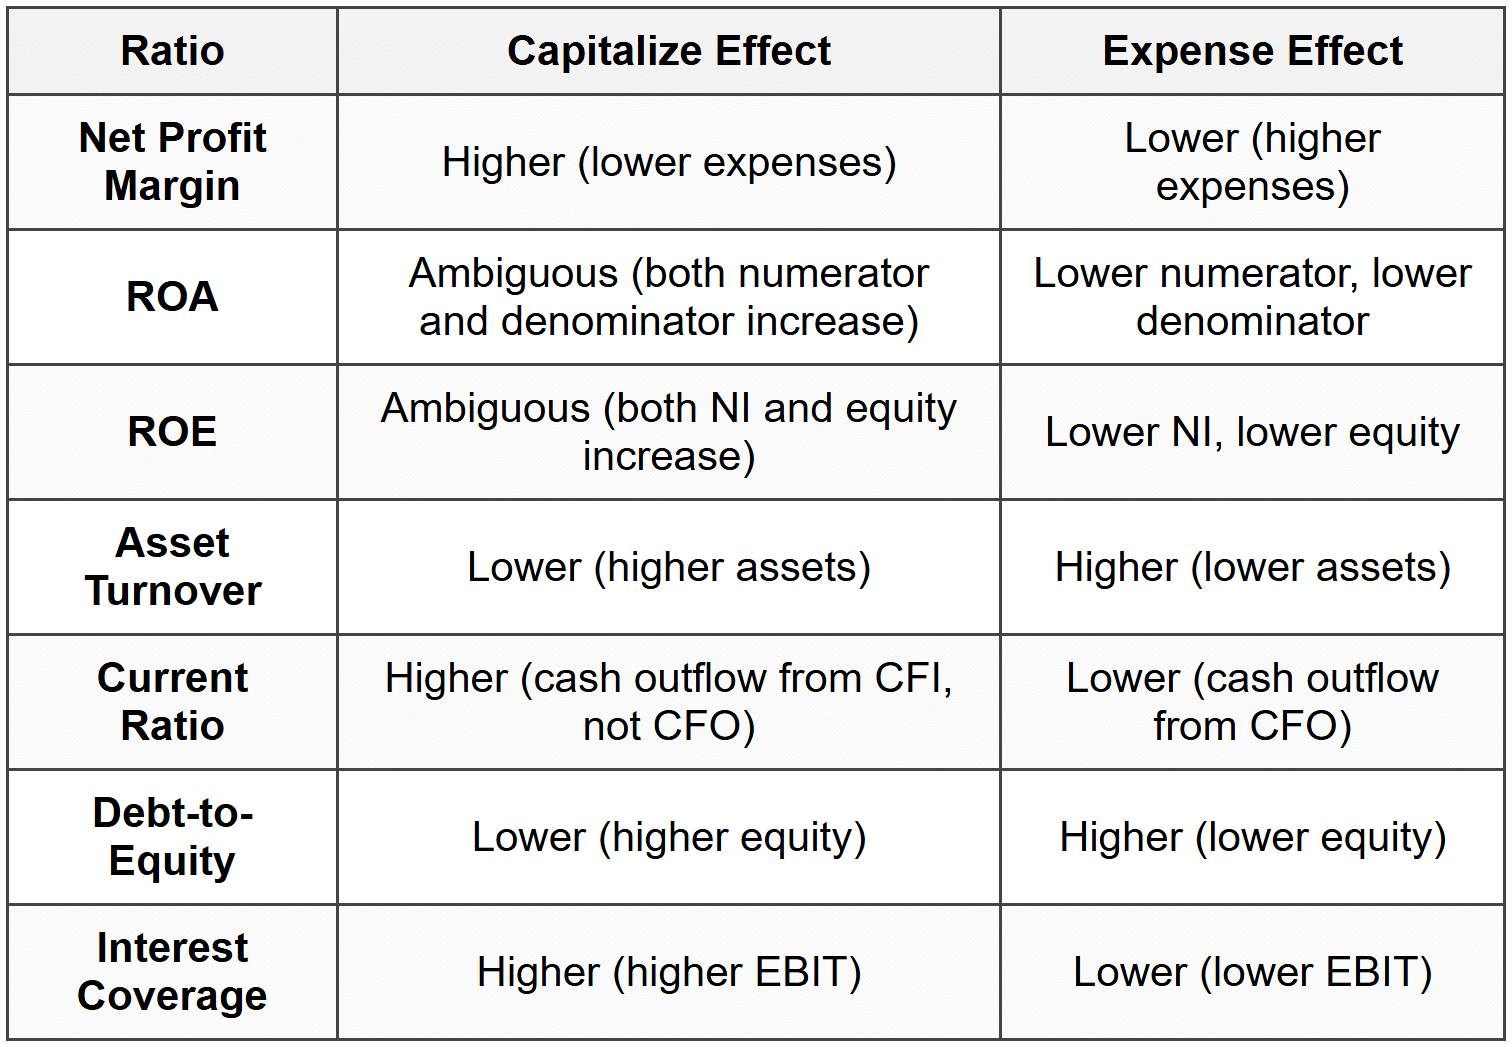
Trap Alert: Companies with aggressive capitalization policies show stronger profitability and solvency ratios initially but may face higher depreciation charges later, depressing future profitability. Analysts must adjust for comparability.
3.6 Analytical Adjustments for Comparability
When comparing companies with different capitalization policies, analysts should:
To convert capitalizer to expenser (Year 0):
- Subtract capitalized amount from assets
- Reduce equity by (capitalized amount × (1 - tax rate))
- Increase expenses by capitalized amount, reduce NI by (capitalized amount × (1 - tax rate))
- Reclassify cash outflow from CFI to CFO
To convert expenser to capitalizer: Reverse the above adjustments.
4. Asset Impairment
Asset impairment occurs when the carrying amount (book value) of an asset exceeds its recoverable amount. Impairment testing ensures assets are not overstated on the balance sheet.
4.1 Impairment Indicators
Companies must assess at each reporting date whether indicators of impairment exist:
- External indicators: Significant market value decline, adverse technological/market/economic changes, increased market interest rates, negative industry trends
- Internal indicators: Obsolescence or physical damage, asset idle or restructuring planned, worse economic performance than expected, asset reclassified as held-for-sale
If indicators exist, formal impairment test is required.
4.2 Impairment Testing Under IFRS (IAS 36)
Two-Step Approach:
Step 1 - Determine Recoverable Amount:
Formula: Recoverable Amount = Higher of (Fair Value - Costs to Sell) OR (Value in Use)
Where:
- Fair Value Less Costs to Sell: Price obtainable in arm's-length transaction minus disposal costs
- Value in Use: Present value of future cash flows expected from asset's continued use and ultimate disposal
Step 2 - Compare and Recognize Impairment Loss:
Formula: Impairment Loss = Carrying Amount - Recoverable Amount (if positive)
Recognition: Impairment loss immediately recognized in profit or loss (unless revaluation model used, then reduce revaluation surplus first).
Example: Machine has carrying amount $500,000. Fair value less costs to sell = $420,000. Value in use = $450,000. Recoverable amount = higher of two = $450,000. Impairment loss = $500,000 - $450,000 = $50,000.
4.3 Impairment Testing Under US GAAP (ASC 360)
Two-Step Approach (Different from IFRS):
Step 1 - Recoverability Test:
Compare carrying amount to undiscounted future cash flows.
Formula: If Carrying Amount > Undiscounted Future Cash Flows → Asset is impaired, proceed to Step 2
If carrying amount ≤ undiscounted future cash flows → No impairment, stop testing.
Step 2 - Measurement of Impairment Loss:
Formula: Impairment Loss = Carrying Amount - Fair Value
Where fair value is the price in orderly transaction between market participants.
Example: Equipment has carrying amount $800,000. Undiscounted future cash flows = $750,000 (fails Step 1). Fair value = $680,000. Impairment loss = $800,000 - $680,000 = $120,000.
4.4 Key Differences: IFRS vs. US GAAP Impairment
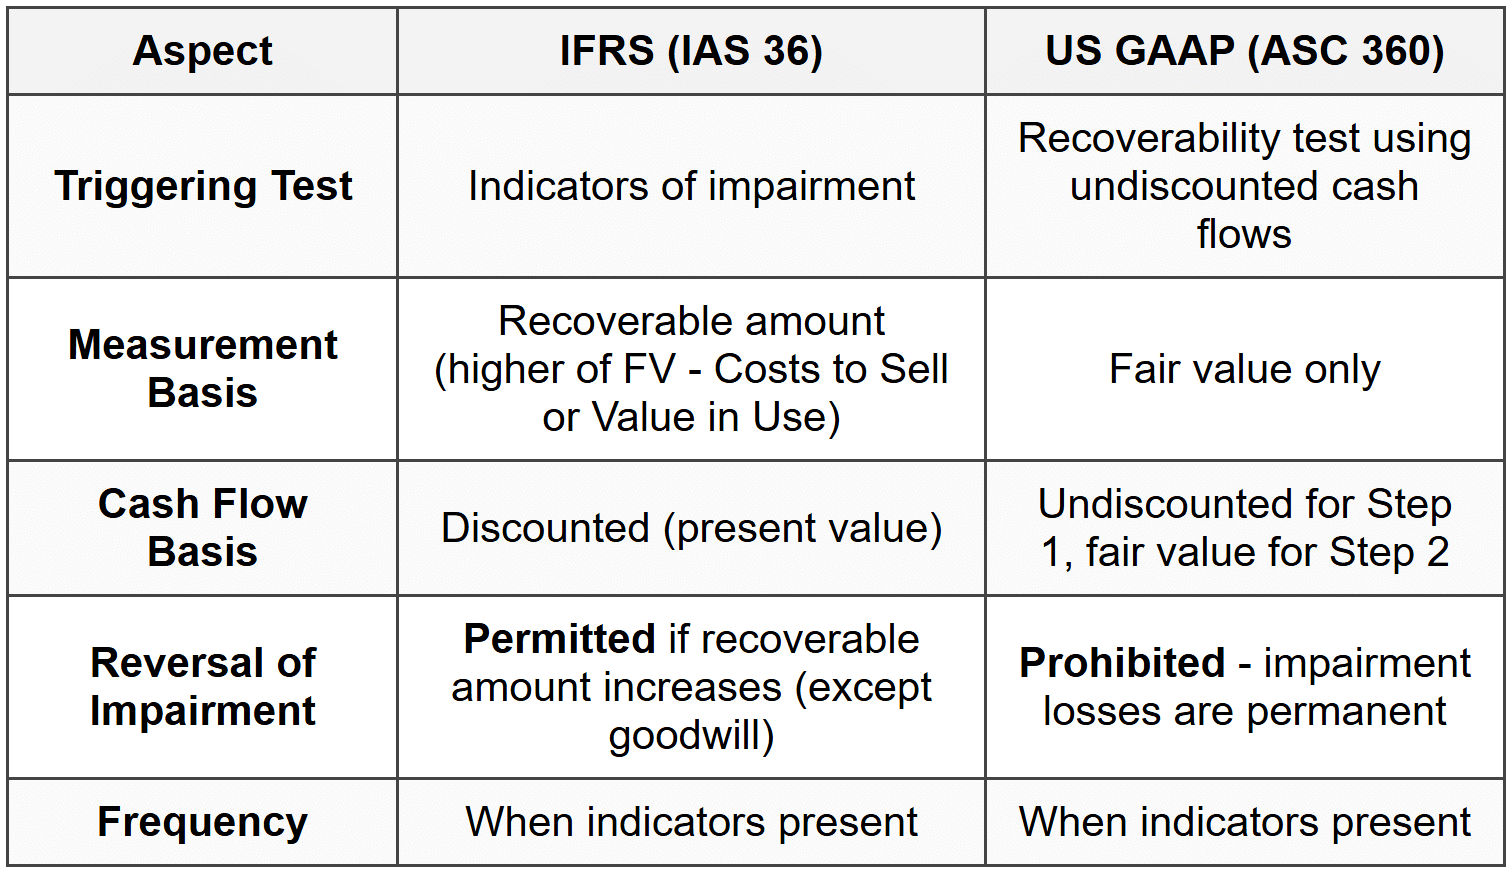
Trap Alert: IFRS allows impairment reversals (increases asset and income), while US GAAP prohibits reversals. This creates significant comparability issues. Analysts must understand which standard applies.
4.5 Financial Statement Impact of Impairment
At Recognition:
- Income Statement: Impairment loss reduces operating income (or reported separately as non-operating)
- Balance Sheet: Reduces carrying amount of asset, reduces equity
- Cash Flow Statement: No cash impact (non-cash charge); add back to net income in CFO under indirect method
Subsequent Periods:
- Lower depreciation expense due to reduced carrying amount (higher future net income)
- May reverse under IFRS if conditions improve (increase income and assets)
4.6 Impairment of Goodwill
Goodwill is not amortized but tested for impairment annually and whenever indicators exist.
Under IFRS: Compare carrying amount of cash-generating unit (CGU) including goodwill to recoverable amount. Impairment loss allocated first to goodwill, then pro-rata to other assets.
Under US GAAP (ASC 350): Test goodwill at reporting unit level. Compare fair value of reporting unit to carrying amount. If carrying amount exceeds fair value, impairment loss is difference (limited to goodwill carrying amount).
Critical Difference: Goodwill impairment is never reversed under both IFRS and US GAAP.
5. Intangible Assets
Intangible assets are identifiable non-monetary assets without physical substance. They represent significant value for knowledge-based and technology companies.
5.1 Classification of Intangible Assets
By Identifiability:
- Identifiable Intangibles: Can be separated and sold, or arise from contractual/legal rights. Examples: patents, trademarks, copyrights, customer lists, franchises, licenses.
- Unidentifiable Intangibles: Cannot be separated from entity. Example: goodwill (arising only in business combinations).
By Useful Life:
- Finite-life intangibles: Have limited useful life, subject to amortization and impairment testing. Examples: patents, copyrights, licenses with expiration.
- Indefinite-life intangibles: No foreseeable limit to period of expected cash flows, not amortized but tested for impairment annually. Examples: trademarks with indefinite renewal, goodwill.
5.2 Recognition and Initial Measurement
Recognition Criteria (same as tangible assets):
- Probable future economic benefits will flow to entity
- Cost can be measured reliably
- Asset is identifiable (for intangibles other than goodwill)
Purchased Intangibles: Capitalize at acquisition cost (purchase price plus directly attributable costs).
Internally Generated Intangibles: Treatment differs significantly:
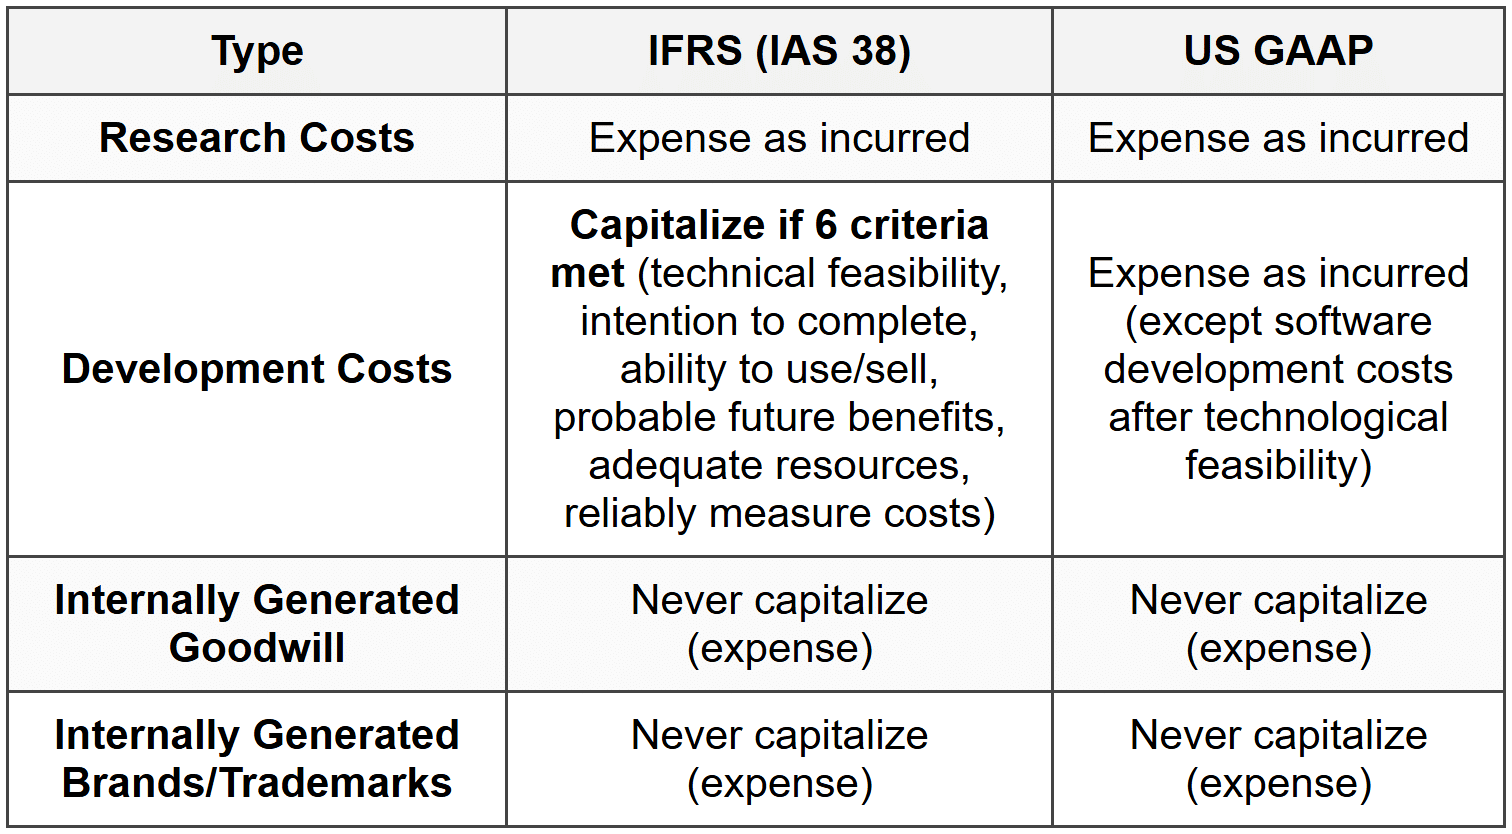
Trap Alert: IFRS permits capitalization of development costs meeting strict criteria, while US GAAP generally requires expensing (major exception: software development costs for sale). This creates significant comparability issues in technology and pharmaceutical industries.
5.3 Amortization of Intangible Assets
Finite-Life Intangibles:
Amortized systematically over useful life. Method should reflect pattern of economic benefit consumption.
Formula: Amortization Expense = (Cost - Residual Value) / Useful Life
Where:
- Residual value: Usually assumed to be zero unless third-party commitment to purchase at end of useful life
- Useful life: Shorter of legal life or economic life
- Default method: Straight-line if pattern cannot be reliably determined
Example: Patent costs $500,000, legal life 20 years, economic life 8 years. Amortize over 8 years: $500,000 / 8 = $62,500 per year.
Indefinite-Life Intangibles:
- Not amortized
- Tested for impairment annually and when indicators present
- Reassess useful life determination each period
5.4 Goodwill
Goodwill arises only in business combinations when purchase price exceeds fair value of identifiable net assets acquired.
Formula: Goodwill = Purchase Price - Fair Value of Identifiable Net Assets
Where:
- Purchase Price: Consideration transferred in acquisition
- Fair Value of Identifiable Net Assets: Fair value of acquired assets (including identifiable intangibles) minus liabilities assumed
Goodwill Components (Economic Interpretation):
- Synergies expected from combination
- Assembled workforce (not separately recognized)
- Expected future growth and profitability above normal returns
- Overpayment by acquirer (negative signal)
Accounting Treatment:
- Never amortized under IFRS and US GAAP (changed from previous standards)
- Tested for impairment at least annually
- Impairment losses never reversed
- Reported as separate line item in intangible assets section
Example: Company A acquires Company B for $10 million. Fair value of identifiable assets = $8 million, liabilities = $2 million. Goodwill = $10M - ($8M - $2M) = $4 million.
5.5 Negative Goodwill (Bargain Purchase)
When fair value of identifiable net assets exceeds purchase price, negative goodwill or bargain purchase gain arises.
Treatment:
- Reassess fair value measurements and acquisition consideration
- If negative goodwill persists, recognize immediately as gain in profit or loss
- Increases net income in acquisition period
5.6 Revaluation Model for Intangibles (IFRS Only)
Permitted only if active market exists for the intangible (rare in practice):
- Active market must provide readily available prices for homogeneous items
- Applies primarily to certain quotas, licenses, and taxi medallions
- Treatment similar to PP&E revaluation model (increases to revaluation surplus in equity)
6. Asset Turnover Analysis
Asset turnover ratios measure how efficiently a company utilizes its assets to generate revenue. Critical for evaluating operational efficiency and comparing peer companies.
6.1 Total Asset Turnover
Measures revenue generated per dollar of total assets.
Formula: Total Asset Turnover = Revenue / Average Total Assets
Where:
- Revenue: Net sales for the period (top line of income statement)
- Average Total Assets: (Beginning Total Assets + Ending Total Assets) / 2
Interpretation:
- Higher ratio indicates more efficient asset utilization (more revenue per asset dollar)
- Lower ratio suggests inefficient use of assets or capital-intensive business model
- Industry-specific: Retailers typically have high turnover (3-4×), utilities low turnover (<>
Example: Company has revenue $5 million, beginning assets $2 million, ending assets $2.4 million. Asset turnover = $5M / [($2M + $2.4M)/2] = $5M / $2.2M = 2.27×
6.2 Fixed Asset Turnover
Focuses specifically on revenue generation relative to investment in long-term tangible assets.
Formula: Fixed Asset Turnover = Revenue / Average Net Fixed Assets
Where:
- Net Fixed Assets: Gross PP&E - Accumulated Depreciation (carrying amount)
- Average Net Fixed Assets: (Beginning Net PP&E + Ending Net PP&E) / 2
Interpretation:
- Higher ratio indicates efficient utilization of plant, equipment, and property
- Very high ratio may suggest aging assets (high accumulated depreciation, low book value)
- Increasing trend may indicate improving operational efficiency or need for capital investment
- Lower for capital-intensive industries (manufacturing, telecom) vs. asset-light businesses (consulting, software)
Example: Company has revenue $8 million, average net PP&E $1.5 million. Fixed asset turnover = $8M / $1.5M = 5.33×
6.3 DuPont Analysis and Asset Turnover
Asset turnover is a critical component of DuPont decomposition of ROE:
Three-Component DuPont Formula:
ROE = (Net Income / Revenue) × (Revenue / Average Assets) × (Average Assets / Average Equity)
ROE = Net Profit Margin × Total Asset Turnover × Equity Multiplier
This decomposition reveals whether ROE is driven by:
- Profitability (Net Profit Margin): Pricing power, cost control
- Efficiency (Total Asset Turnover): Operational management
- Leverage (Equity Multiplier): Financial structure
Example: Company A has ROE 15% with 5% margin, 2.0× turnover, 1.5× leverage. Company B has ROE 15% with 10% margin, 1.0× turnover, 1.5× leverage. Both have identical ROE but Company A achieves it through superior asset efficiency, while Company B relies on higher margins.
6.4 Impact of Depreciation Policy on Turnover Ratios
Since asset turnover uses net book value (cost minus accumulated depreciation) in denominator, depreciation method affects ratio:
- Accelerated depreciation: Higher accumulated depreciation → lower net PP&E → higher fixed asset turnover
- Straight-line depreciation: Lower accumulated depreciation → higher net PP&E → lower fixed asset turnover
- Older assets: More accumulated depreciation → very high turnover (may not reflect true efficiency)
- New assets: Little accumulated depreciation → lower turnover initially
Trap Alert: Companies with old, fully-depreciated assets can show artificially high asset turnover ratios. Similarly, recent major capital expenditures depress turnover temporarily. Analysts must consider age of asset base when interpreting turnover ratios.
6.5 Analytical Adjustments for Asset Turnover Comparability
When comparing companies with different accounting policies:
Adjusting for Capitalization Policy Differences:
If Company A capitalizes expenditures while Company B expenses them:
- Add back capitalized amounts to Company A's expenses (reduces net income)
- Subtract capitalized amounts from Company A's assets
- Recalculate asset turnover on adjusted basis
Adjusting for Depreciation Method Differences:
Convert accelerated depreciation company to straight-line basis:
- Calculate straight-line depreciation for all assets
- Adjust accumulated depreciation to straight-line amount
- Recalculate net PP&E and asset turnover
Adjusting for Operating Leases (Pre-IFRS 16/ASC 842):
Companies using operating leases showed higher turnover (assets off balance sheet). Analysts would capitalize operating leases to make comparable with companies using capital leases:
- Estimate present value of future lease payments
- Add to assets and liabilities
- Recalculate turnover ratio
Note: IFRS 16 and ASC 842 now require most leases on balance sheet, reducing this comparability issue.
6.6 Average Age of Assets
Analysts estimate asset age to assess whether low turnover reflects new investments or obsolete assets:
Formula - Average Age of Assets:
Average Age = Accumulated Depreciation / Depreciation Expense
Formula - Average Remaining Useful Life:
Remaining Life = Net PP&E / Depreciation Expense
Formula - Estimated Total Useful Life:
Total Useful Life = Gross PP&E / Depreciation Expense
Example: Company has gross PP&E $1,000,000, accumulated depreciation $400,000, annual depreciation expense $100,000.
- Average age = $400,000 / $100,000 = 4 years
- Remaining life = ($1,000,000 - $400,000) / $100,000 = 6 years
- Total useful life = $1,000,000 / $100,000 = 10 years
Interpretation: Older assets (higher age) may require significant capital expenditures soon for replacement. Very old assets with high turnover suggest need for reinvestment.
7. Practical Examples and Exam Applications
7.1 Comprehensive Example: Capitalization vs. Expensing Impact
Scenario: Two identical companies, A and B, each spend $1,000,000 on equipment upgrade. Company A capitalizes (5-year straight-line, no salvage), Company B expenses immediately. Tax rate 30%. First year revenue $5,000,000, other expenses $2,000,000.
Company A (Capitalize):
- Revenue: $5,000,000
- Other expenses: $2,000,000
- Depreciation: $1,000,000 / 5 = $200,000
- EBIT: $5,000,000 - $2,000,000 - $200,000 = $2,800,000
- Net Income: $2,800,000 × (1 - 0.30) = $1,960,000
- Assets increased by: $1,000,000 - $200,000 = $800,000 (net)
- CFO: $1,960,000 + $200,000 (add back depreciation) = $2,160,000
- CFI: -$1,000,000 (capital expenditure)
Company B (Expense):
- Revenue: $5,000,000
- Other expenses: $2,000,000
- Equipment expense: $1,000,000
- EBIT: $5,000,000 - $2,000,000 - $1,000,000 = $2,000,000
- Net Income: $2,000,000 × (1 - 0.30) = $1,400,000
- No asset increase
- CFO: $1,400,000 (no addback needed) = $1,400,000
- CFI: $0
Comparative Impact Summary:
- Net Income: A is $560,000 higher (40% more)
- Total Assets: A is $800,000 higher
- CFO: A is $760,000 higher (better operating cash generation appearance)
- CFI: A is $1,000,000 lower (investment activity shown)
- Total Cash: Both same (spent $1,000,000 total)
Exam Insight: Questions often ask to identify which company appears more profitable, has better cash flow, or requires adjustment for comparability. Recognize that capitalizers show inflated short-term performance.
7.2 Practice Question: Impairment Under IFRS vs US GAAP
Question: Equipment has carrying amount $5,000,000. Undiscounted future cash flows = $4,800,000. Present value of future cash flows (value in use) = $4,200,000. Fair value less costs to sell = $4,400,000. Fair value = $4,500,000. Determine impairment loss under (a) IFRS and (b) US GAAP.
Solution:
(a) IFRS (IAS 36):
- Recoverable amount = higher of (FV - costs to sell, value in use) = higher of ($4,400,000, $4,200,000) = $4,400,000
- Impairment loss = Carrying amount - Recoverable amount = $5,000,000 - $4,400,000 = $600,000
(b) US GAAP (ASC 360):
- Step 1 Recoverability Test: Carrying amount ($5,000,000) > Undiscounted cash flows ($4,800,000) → Impaired, proceed to Step 2
- Step 2 Measurement: Impairment loss = Carrying amount - Fair value = $5,000,000 - $4,500,000 = $500,000
Key Learning: Same asset, different impairment amounts under different standards. IFRS recognizes larger loss ($600,000) because recoverable amount uses lower value ($4,400,000 vs. $4,500,000). Analysts must know which standard company uses.
7.3 Practice Question: Asset Turnover Adjustment
Question: Company X has revenue $10 million, beginning net PP&E $2 million, ending net PP&E $2.4 million. During year, company expensed $300,000 in equipment upgrades that should have been capitalized (assume 5-year life, straight-line). Calculate: (a) reported fixed asset turnover, (b) adjusted fixed asset turnover.
Solution:
(a) Reported Fixed Asset Turnover:
- Average net PP&E = ($2M + $2.4M) / 2 = $2.2M
- Reported turnover = $10M / $2.2M = 4.55×
(b) Adjusted Fixed Asset Turnover:
- Adjustment: Add $300,000 to assets, subtract first year depreciation $300,000/5 = $60,000
- Adjusted ending PP&E = $2.4M + $300,000 - $60,000 = $2.64M
- Adjusted average PP&E = ($2M + $2.64M) / 2 = $2.32M
- Adjusted turnover = $10M / $2.32M = 4.31×
Key Learning: Expensing (instead of capitalizing) artificially inflates asset turnover by understating asset base. Adjustment reduces turnover from 4.55× to 4.31×, providing more accurate efficiency measure.
7.4 Practice Question: Development Costs Capitalization
Question: Pharmaceutical company incurred $5 million research costs and $8 million development costs (meeting all IFRS capitalization criteria). Under (a) IFRS and (b) US GAAP, how much is capitalized vs. expensed?
Solution:
(a) IFRS (IAS 38):
- Research costs: Expense $5 million
- Development costs: Capitalize $8 million (criteria met)
- Total expense = $5M, Total capitalized = $8M
(b) US GAAP:
- Research costs: Expense $5 million
- Development costs: Expense $8 million (US GAAP requires expensing)
- Total expense = $13M, Total capitalized = $0
Impact on Financial Statements:
- IFRS company shows $8M higher net income (ignoring amortization), $8M higher assets
- US GAAP company shows lower profitability, lower assets, lower equity
- ROA comparison: IFRS company appears more profitable but has higher asset base (ambiguous effect)
- Asset turnover: IFRS company has lower turnover (higher denominator)
Analyst Action: To compare IFRS pharma company with US GAAP peer, adjust IFRS company by expensing the $8M development costs (reduce assets, reduce equity, reduce net income by after-tax amount).
8. Common Exam Pitfalls and Traps
8.1 Depreciation Method Confusion
Trap: Confusing which method produces higher income in early years.
Correct Understanding:
- Straight-line: Lower expense → Higher net income early years
- Accelerated (DDB): Higher expense → Lower net income early years
- Over full asset life, total depreciation identical under all methods
Trap: Applying salvage value in double-declining balance calculation.
Correct Understanding: DDB applies rate to book value, not (cost - salvage value). Salvage value only acts as floor (stop depreciating when book value reaches salvage value).
8.2 Impairment Reversal Rules
Trap: Assuming impairment reversals allowed under US GAAP.
Correct Understanding:
- IFRS: Reversals permitted for all assets except goodwill
- US GAAP: Reversals prohibited for all long-lived assets including PP&E and intangibles
- Both prohibit goodwill impairment reversal
8.3 Capitalized Interest Impact
Trap: Thinking capitalized interest reduces total interest expense permanently.
Correct Understanding:
- Interest capitalization only delays expense recognition through depreciation
- Total expense over asset life = interest capitalized + subsequent depreciation of capitalized interest
- Benefit: Higher net income during construction, but lower in subsequent years due to higher depreciation
8.4 Asset Turnover Interpretation
Trap: Assuming higher asset turnover always indicates superior performance.
Correct Understanding:
- Very high turnover may indicate aging assets (low book value from high accumulated depreciation)
- Declining turnover may indicate recent major capital investments (positive for future growth)
- Must compare to industry benchmarks and consider asset age
8.5 Component Depreciation Requirements
Trap: Assuming component depreciation optional under IFRS.
Correct Understanding:
- IFRS: Component depreciation required if significant parts have different useful lives
- US GAAP: Component depreciation permitted but not required
- IFRS companies typically report higher initial depreciation expense
8.6 Goodwill Amortization
Trap: Thinking goodwill should be amortized over useful life.
Correct Understanding:
- Goodwill is not amortized under current IFRS and US GAAP
- Tested for impairment annually and when indicators present
- Historical note: Pre-2001 standards required amortization; current standards eliminated this
8.7 Intangible Asset Recognition
Trap: Capitalizing all development costs under US GAAP.
Correct Understanding:
- IFRS: May capitalize development costs if six specific criteria met
- US GAAP: Generally expense all R&D costs (exception: software development costs after technological feasibility for software to be sold)
- Internally generated brands/goodwill: Never capitalize under either standard
8.8 Cash Flow Classification
Trap: Thinking capitalization affects total cash flow.
Correct Understanding:
- Capitalization does not change total cash outflow
- Only changes classification: capitalized expenditures in CFI, expensed in CFO
- Companies capitalizing show higher CFO (appears operationally stronger)
- Analysts must adjust for comparability by reclassifying capitalized amounts to CFO
9. Key Formulas Summary
9.1 Depreciation Formulas
- Straight-Line Annual Depreciation: (Cost - Salvage Value) / Useful Life
- Double-Declining Balance: Book Value at Beginning × (2 / Useful Life)
- Units-of-Production: [(Cost - Salvage Value) / Total Estimated Units] × Units Produced
- Depreciable Base: Historical Cost - Salvage Value
9.2 Impairment Formulas
IFRS:
- Recoverable Amount: Higher of (Fair Value - Costs to Sell) OR (Value in Use)
- Impairment Loss: Carrying Amount - Recoverable Amount (if positive)
US GAAP:
- Step 1 Test: Compare Carrying Amount to Undiscounted Future Cash Flows
- Step 2 Impairment Loss: Carrying Amount - Fair Value (if Step 1 failed)
9.3 Asset Turnover Formulas
- Total Asset Turnover: Revenue / Average Total Assets
- Fixed Asset Turnover: Revenue / Average Net PP&E
- Average Age of Assets: Accumulated Depreciation / Annual Depreciation Expense
- Average Remaining Life: Net PP&E / Annual Depreciation Expense
- Total Useful Life: Gross PP&E / Annual Depreciation Expense
9.4 Other Important Formulas
- Interest Capitalization: Weighted Average Accumulated Expenditures × Appropriate Interest Rate (capped at actual interest)
- Goodwill: Purchase Price - Fair Value of Identifiable Net Assets
- Basket Purchase Allocation: (Individual Fair Value / Total Fair Value) × Total Purchase Price
- DuPont ROE (3-component): Net Profit Margin × Total Asset Turnover × Equity Multiplier
10. Memorization Techniques and Mnemonics
10.1 IFRS Development Cost Capitalization Criteria (6 Criteria)
Mnemonic: "TI CAPR"
- Technical feasibility demonstrated
- Intention to complete and use/sell
- Capability to use or sell
- Adequate resources available to complete
- Probable future economic benefits
- Reliably measure costs
10.2 Capitalizable Costs for PP&E
Mnemonic: "PADS IP"
- Purchase price
- Assembly and installation
- Delivery and handling
- Site preparation
- Interest during construction (if qualifying)
- Professional fees directly attributable
10.3 Impairment Testing: IFRS vs US GAAP
Memory Aid:
- IFRS: "IFRS Favors Recovery" - allows impairment reversal
- US GAAP: "US Generally Against Permanence" - permanent impairment, no reversal
10.4 Financial Statement Effects
Capitalize vs. Expense (First Year):
"CAP Boosts ANIE" (Capitalize Boosts Assets, Net Income, Equity):
- Assets: Higher when capitalized
- Net Income: Higher when capitalized (only depreciation deducted)
- Equity: Higher when capitalized
Cash Flow Classification: "Capitalize Shifts to Investment" - capitalized amounts appear in CFI instead of CFO
10.5 Accelerated vs Straight-Line Early Years
"Accelerated Attacks Income" - Accelerated depreciation reduces net income more in early years
"Straight Saves Income" - Straight-line preserves higher net income early
Conclusion paragraph summarizing the key takeaways in simple language for exam preparation...
Mastering long-term asset analysis requires understanding both accounting mechanics and analytical implications. For exam success, focus on: (1) accurately applying depreciation formulas for different methods and understanding their comparative financial statement impacts, (2) distinguishing IFRS vs US GAAP treatments for impairment testing, development costs, and component depreciation, (3) recognizing how capitalization vs expensing decisions affect profitability, asset levels, and cash flow classification, (4) calculating and interpreting asset turnover ratios while considering asset age and depreciation policy effects, and (5) making appropriate analytical adjustments to enhance comparability between companies using different accounting policies. Remember that management's choices regarding asset accounting significantly impact reported performance metrics, valuation multiples, and ratio analysis - critical skills for financial statement analysis and equity valuation at CFA Level 1. Practice applying formulas, work through comparative examples, and memorize key differences between standards to maximize exam performance in this high-weight topic area.