Product & Project Management Exam > Product & Project Management Notes > The Project Management Course: Beginner to Project Manager > Excel for Project Tracking and Reporting
Excel for Project Tracking and Reporting

# Excel for Project Tracking and Reporting
 Insert a Clustered Column Chart to visualize this comparison instantly.

What Is Project Tracking and Why Excel?
Imagine you're planning a friend's surprise birthday party. You need to book a venue, order a cake, send invitations, arrange decorations, and manage a budget. How do you keep track of what's done, what's pending, who's responsible, and whether you're overspending? You could use sticky notes, but they fall off. You could keep it all in your head, but you'd forget half of it. Or you could use a simple spreadsheet where everything is visible, organized, and updateable in real time. Project tracking is the systematic process of monitoring all the tasks, timelines, resources, and budgets associated with a project to ensure it stays on course and reaches its goals. Reporting is the act of communicating the project's status, progress, and problems to stakeholders-the people who care about the project's outcome, like your boss, clients, or team members. Microsoft Excel has been the go-to tool for project tracking and reporting for decades because:- It's widely available and most professionals already know the basics
- It's flexible-you can customize it to fit any project structure
- It handles calculations automatically, saving you from manual math errors
- It can create visual reports like charts and dashboards that make complex data easy to understand
- It doesn't require expensive project management software licenses
Core Components of an Excel Project Tracker
When you build a project tracker in Excel, you're essentially creating a living document that captures five critical dimensions of your project:Task List and Breakdown
Every project is made up of individual tasks-specific, actionable pieces of work that need completion. Your Excel tracker should list every task clearly, typically in rows, with each row representing one task. For example, if you're launching a new mobile app, your tasks might include:- Design user interface mockups
- Develop login functionality
- Write privacy policy
- Test on iOS devices
- Submit to App Store
- Create marketing materials
- Task ID: A unique number or code (like T001, T002) that helps you reference tasks without confusion
- Task Name: A clear, action-oriented description
- Task Description: Additional details about what the task entails (optional but helpful for clarity)
- Category or Phase: Grouping tasks into logical buckets like "Design," "Development," "Testing," or "Marketing"
Timeline and Dates
Time is the most precious resource in any project. Your tracker needs to capture when things start, when they should finish, and how long they're taking. Essential date columns include:- Start Date: When work on this task begins
- Due Date: The deadline for task completion
- Actual Completion Date: When the task was actually finished (often different from the due date)
- Duration: How many days or hours the task should take
=D2-C2
This gives you the number of days between the two dates. If you want to exclude weekends, use the NETWORKDAYS function:
=NETWORKDAYS(C2,D2)
Tracking dates lets you spot problems early. If a task due on March 15th is still incomplete on March 20th, you know you're behind schedule and need to take action.
Responsibility and Ownership
Every task needs an owner-someone who's accountable for getting it done. In your Excel tracker, add a column for Assigned To or Owner, listing the person's name. Why does this matter? The diffusion of responsibility is a psychological phenomenon where if everyone is responsible, no one feels responsible. When Sarah knows she personally owns "Design user interface mockups," there's no confusion about who needs to deliver. You might also include:- Reviewer or Approver: Who needs to check and approve the completed work
- Stakeholder: Who should be kept informed about this task
Status Tracking
Status tells you where each task stands right now. Common status categories include:- Not Started: Work hasn't begun
- In Progress: Currently being worked on
- On Hold: Paused, waiting for something else
- Completed: Finished and approved
- Cancelled: No longer needed
- Red: Task is at risk, behind schedule, or blocked
- Amber/Yellow: Task has minor issues but is manageable
- Green: Task is on track
Budget and Cost Tracking
Most projects have financial constraints. Your tracker should include:- Estimated Cost: How much you budgeted for this task
- Actual Cost: How much you actually spent
- Variance: The difference between estimated and actual
=H2-G2 (where G2 is Estimated Cost and H2 is Actual Cost)
A positive variance means you overspent; a negative variance means you underspent. You can add a Variance % to see this proportionally:
\[ \text{Variance %} = \frac{\text{Variance}}{\text{Estimated Cost}} \times 100 \]
In Excel: =(H2-G2)/G2*100
At the bottom of these columns, use the SUM function to calculate total budget, total spent, and overall variance:
=SUM(G2:G50)
This gives project managers instant visibility into whether they're on budget or headed for financial trouble.
Building Your First Project Tracker: Step by Step
Let's create a functional project tracker from scratch for a hypothetical project: launching a company blog.Step 1: Set Up Your Column Headers
Open a blank Excel worksheet. In row 1, create these column headers (one per cell starting from A1):- Task ID
- Task Name
- Category
- Assigned To
- Start Date
- Due Date
- Duration (days)
- Status
- % Complete
- Estimated Cost
- Actual Cost
- Variance
- Notes
Step 2: Populate Your Tasks
Starting in row 2, list out your tasks. For our blog launch:- T001 | Choose blogging platform | Planning | Alex | 01-Mar-2024 | 05-Mar-2024
- T002 | Purchase domain name | Planning | Jordan | 06-Mar-2024 | 08-Mar-2024
- T003 | Design blog layout | Design | Casey | 09-Mar-2024 | 20-Mar-2024
- T004 | Write first 5 blog posts | Content | Morgan | 15-Mar-2024 | 30-Mar-2024
- T005 | Set up SEO plugins | Technical | Alex | 21-Mar-2024 | 25-Mar-2024
- T006 | Launch blog | Launch | Jordan | 01-Apr-2024 | 01-Apr-2024
Step 3: Add Formulas for Automatic Calculations
In the Duration column (G2), add the formula:=F2-E2
This calculates the number of days between Start Date and Due Date. Copy this formula down for all tasks (drag the fill handle or copy-paste).
In the Variance column (L2), add:
=K2-J2
This shows the difference between Actual Cost and Estimated Cost. Copy down.
Step 4: Create Status Dropdowns
Select all cells in the Status column where you'll enter data (H2:H100, for example). Go to Data → Data Validation → List In the Source box, type:Not Started,In Progress,On Hold,Completed,Cancelled
Click OK. Now each cell in that column shows a dropdown menu with these exact options.
Step 5: Apply Conditional Formatting for Visual Alerts
Let's make overdue tasks turn red automatically. Select your Due Date column. Go to Home → Conditional Formatting → New Rule → Use a formula to determine which cells to format Enter this formula (assuming you're starting at F2):=AND(F2
This means: "If the due date is before today AND the status is not Completed, flag it."
Choose a red fill color. Click OK.
Now any task past its due date that's not completed will highlight in red.
Step 6: Add Summary Calculations
Below your task list, create a summary section:- Total Tasks:
=COUNTA(A2:A100)(counts non-empty task IDs) - Completed Tasks:
=COUNTIF(H2:H100,"Completed") - Completion Rate:
=Completed Tasks / Total Tasks - Total Budget:
=SUM(J2:J100) - Total Spent:
=SUM(K2:K100) - Budget Variance:
=Total Spent - Total Budget
Creating Gantt Charts in Excel
A Gantt chart is a horizontal bar chart that shows tasks over time, making it easy to see what's happening when and how tasks overlap. It's named after Henry Gantt, who popularized this chart in the 1910s for shipbuilding projects. Excel doesn't have a built-in Gantt chart, but you can create one using a stacked bar chart-a clever workaround.The Logic Behind an Excel Gantt Chart
The idea is to create two data series:- Start Day: The number of days from your project start date until each task begins
- Duration: How many days each task takes
Building a Simple Gantt Chart
Let's say your project starts on March 1, 2024. Create two new columns:- Start Day Number: Days from project start to task start
- Duration: Days the task takes
=E2-$M$1
The dollar signs make M1 an absolute reference so it doesn't change when you copy the formula.
For Duration, you already have this: =F2-E2
Now:
- Select your Task Names, Start Day Numbers, and Duration columns
- Go to Insert → Bar Chart → Stacked Bar
- Right-click the Start Day Number bars (the first series) and choose Format Data Series → No Fill to make them invisible
- Right-click the horizontal axis and choose Format Axis, then set the minimum and maximum to match your project timeline
Dashboard Reporting: Turning Data Into Insights
A dashboard is a visual summary page that presents key project metrics in charts, graphs, and indicators-designed so busy stakeholders can understand project status in 30 seconds or less. Think of it like the dashboard in your car: you don't need to know every detail of engine temperature, fuel mixture, and tire pressure individually. You need to know speed, fuel level, and warning lights. Same concept for projects.Key Elements of a Project Dashboard
1. Overall Progress Indicator
Show what percentage of tasks are complete using a doughnut chart or progress bar. Calculate completion percentage: \[ \text{Completion %} = \frac{\text{Completed Tasks}}{\text{Total Tasks}} \times 100 \] Create a simple table:- Completed: 12
- Remaining: 18
2. Status Breakdown
Create a column chart or pie chart showing how many tasks are in each status category. Use COUNTIF formulas:- Not Started:
=COUNTIF(H:H,"Not Started") - In Progress:
=COUNTIF(H:H,"In Progress") - On Hold:
=COUNTIF(H:H,"On Hold") - Completed:
=COUNTIF(H:H,"Completed")
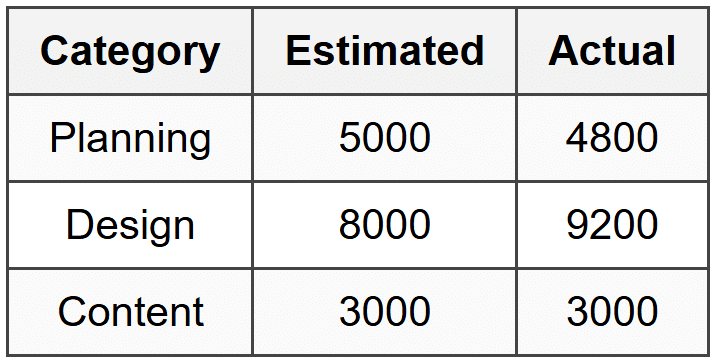
3. Budget Performance
Show a clustered column chart comparing Estimated vs. Actual costs by category. Use a SUMIF formula to total costs by category:=SUMIF(C:C,"Design",J:J)
This sums all estimated costs (column J) where the category (column C) is "Design."
Create a table:
Insert a Clustered Column Chart to visualize this comparison instantly.
4. Timeline View
Your Gantt chart (or a simplified version) shows what's happening when.5. Risk and Issue Tracker
A small table highlighting tasks with Red RAG status or overdue dates:=FILTER(A:H, (H:H="Red") + (F:F<>
This formula (available in Excel 365) automatically shows only the risky or overdue tasks.
Real-World Example: Spotify's Internal Project Tracking
Spotify famously uses squad-based teams (small, cross-functional groups) to manage product development. While they use specialized tools like Jira for software development, many internal operational projects-like office expansions, marketing campaigns, or event planning-still rely on Excel and Google Sheets for tracking. In 2016, when Spotify planned its global "Wrapped" campaign (the personalized year-end summary sent to users), the campaign team used Excel extensively to track:- Content creation tasks across 20+ markets and languages
- Translation deadlines
- Design asset delivery
- Email send schedules
- Budget allocation per market
Advanced Excel Functions for Project Tracking
Conditional Calculations with SUMIF and COUNTIF
SUMIF adds up numbers based on a condition. Syntax:=SUMIF(range_to_check, condition, range_to_sum)
Example: "What's the total estimated cost for all tasks assigned to Alex?"
=SUMIF(D:D, "Alex", J:J)
This checks column D (Assigned To), finds "Alex," and sums the corresponding values in column J (Estimated Cost).
COUNTIF counts cells that meet a condition:
=COUNTIF(H:H, "Completed")
Counts how many cells in column H contain "Completed."
You can combine these for completion rates by person:
\[ \text{Alex's Completion Rate} = \frac{\text{COUNTIFS(D:D,"Alex",H:H,"Completed")}}{\text{COUNTIF(D:D,"Alex")}} \times 100 \]
Dates and Deadlines with TODAY and IF
TODAY() returns the current date. It updates automatically every day. You can create a "Days Until Due" column:=F2-TODAY()
If the result is negative, the task is overdue.
Combine with IF for status messages:
=IF(F2
This formula says: "If the due date is before today, display 'OVERDUE', otherwise display 'On Time'."
You can nest IFs for more complex logic:
=IF(H2="Completed", "Done", IF(F2
Translation: "If status is Completed, say 'Done.' If not, check if due date is past-if yes, say 'OVERDUE,' if no, say 'On Track.'"
Automating Task Dependencies
Many tasks depend on others. You can't launch the blog (T006) until the design is complete (T003). Create a Predecessor column listing the Task ID that must finish first. Then create a Calculated Start Date:=IF(Predecessor="", Planned_Start, VLOOKUP(Predecessor, Task_Table, Completion_Date_Column, FALSE))
This checks if there's a predecessor. If not, use the planned start date. If yes, look up that task's completion date and use it as this task's start date.
This is getting into more advanced territory, but it's powerful for maintaining logical task sequences automatically.
Using PivotTables for Dynamic Reporting
A PivotTable is one of Excel's most powerful features for summarizing large datasets. Imagine you have 500 tasks across 10 categories and 20 team members. You want to see:- How many tasks each person has
- What percentage are complete
- Total costs by category
- Rows: Assigned To
- Values: Count of Task ID (shows how many tasks per person)
- Filters: Status (so you can filter to see only Completed tasks)
Best Practices for Excel Project Tracking
Keep It Simple and Consistent
The best tracker is one people actually use. Overly complicated spreadsheets with dozens of columns, nested formulas, and confusing layouts get abandoned. Start with the essentials: Task, Owner, Dates, Status. Add complexity only when needed. Use consistent naming conventions. If you abbreviate "Marketing" as "Mktg" in one place, don't spell it out as "Marketing" elsewhere-it breaks filters and formulas.Protect Your Formulas
Accidental deletion of a formula can break your entire tracking system. Use cell protection: Select cells with formulas, right-click → Format Cells → Protection → Locked. Then go to Review → Protect Sheet. Now formula cells can't be edited, but data entry cells remain open.Version Control and Backup
Save dated versions: "Project_Tracker_v1_2024-03-15.xlsx" Use OneDrive or SharePoint for automatic cloud backup and version history, letting you restore previous versions if something goes wrong.Update Regularly and Rigorously
A project tracker is only useful if it reflects reality. Establish a rhythm:- Team members update task status every Monday and Thursday
- Project manager reviews and updates the tracker every Friday
- Dashboard is shared with stakeholders every Monday morning
Use Data Validation to Prevent Errors
Beyond status dropdowns, use data validation for:- Dates: Restrict to dates only, preventing text entry
- Percentages: Allow only 0, 25, 50, 75, 100
- Names: Create a list of team members to ensure consistent spelling
Separate Data Entry from Reporting
Create two sheets in your workbook:- Data Entry: Where team members input task updates
- Dashboard: Where formulas pull from the Data Entry sheet to create visualizations
Limitations of Excel and When to Upgrade
Excel is powerful but has boundaries. Recognize when you've outgrown it:Collaboration Challenges
Excel wasn't designed for 50 people editing simultaneously. While Microsoft 365's cloud version allows co-authoring, it's clunky compared to dedicated project management platforms. If more than 5-10 people need real-time access, consider tools like Asana, Monday.com, or Microsoft Project.No Automatic Notifications
Excel won't email Sarah when her task is due tomorrow or alert the team when you mark something as Red status. You can create macros for this, but it's complex. Dedicated tools send automatic reminders and notifications.Limited Task Dependencies and Critical Path Analysis
While you can build dependencies in Excel, calculating the critical path-the sequence of dependent tasks that determines the minimum project duration-requires complex formulas or VBA scripting. Tools like Microsoft Project handle this natively with algorithms.Scalability
For a 30-task project with 5 people, Excel is perfect. For a 3,000-task enterprise project with 200 team members across 10 countries, it becomes unwieldy. The practical limit for Excel project tracking is around 200-300 tasks.Real-Time Reporting and Integration
Excel doesn't automatically pull data from other systems (unless you use Power Query, an advanced feature). If you need real-time integration with CRM, accounting software, or development tools, specialized platforms offer APIs and native integrations.Real-World Example: NASA's Mars Rover Projects
Even organizations with access to the most sophisticated tools sometimes rely on Excel for specific project tracking needs. During the Mars Rover missions (Spirit and Opportunity in 2004, Curiosity in 2012, Perseverance in 2021), NASA's Jet Propulsion Laboratory used specialized project management systems for overall mission coordination. However, individual subsystem teams-like the team designing the rover's robotic arm or the camera systems-often used Excel for their internal task tracking. Why? Because Excel allowed engineers to customize tracking to their specific needs:- Tracking test results alongside task completion
- Calculating tolerances and error margins in the same sheet as schedule data
- Creating custom visualizations that showed technical data in ways standard PM tools couldn't
- Test temperature ranges (Mars surface temperatures vary from -125°C to 20°C)
- Pass/fail results for each calibration test
- Dependencies between hardware installation and software testing
- Budget tracking for prototype builds vs. final components
Templates and Starter Frameworks
You don't have to build every tracker from scratch. Excel offers built-in templates, and thousands are available online.Using Built-in Templates
In Excel, go to File → New and search for "project tracker" or "Gantt chart." Microsoft provides professionally designed templates with pre-built formulas and formatting. Common templates include:- Simple Project Tracker: Basic task list with status and dates
- Project Timeline: Visual Gantt-style timeline
- Project Budget Tracker: Focus on costs and spending
- Agile Sprint Tracker: For software development teams using Scrum methodology
Customizing Templates
Templates are starting points. Modify them:- Add columns specific to your industry (e.g., "Client Name" for agency projects, "Compliance Status" for regulated industries)
- Change status categories to match your workflow
- Adjust formulas to calculate metrics you care about
Reporting Formats: What Stakeholders Need
Different audiences need different information from your project tracker.Executive Summary (for Senior Management)
Executives want the big picture in 60 seconds or less:- Overall completion percentage
- Budget status (on/over/under)
- Timeline status (on/ahead/behind)
- Top 3 risks or blockers
- A large completion percentage in the top left (like "73% Complete")
- A traffic light indicator for Budget and Schedule (green/yellow/red)
- A short bullet list of critical issues
Team Status Report (for Project Team)
Your team needs operational details:- What tasks are due this week
- Who owns what
- What's blocked and needs help
- Upcoming deadlines
- All tasks with status "In Progress" or "Not Started"
- Sorted by due date (soonest first)
- Grouped by person
Client Progress Report (for External Stakeholders)
Clients want reassurance and transparency:- What's been completed since the last report
- What's coming next
- Any changes to timeline or budget
- A summary paragraph ("This week we completed the design phase and began development...")
- A milestone chart showing major phases
- A simplified Gantt chart (not every task, just major deliverables)
- Budget snapshot
Common Excel Formulas for Project Management
Here's a quick reference of the most useful formulas:COUNTIF and COUNTIFS
Count cells meeting one or more conditions. Single condition:=COUNTIF(range, criteria)
Example: Count completed tasks
=COUNTIF(H:H, "Completed")
Multiple conditions:
=COUNTIFS(range1, criteria1, range2, criteria2)
Example: Count tasks assigned to Jordan that are completed
=COUNTIFS(D:D, "Jordan", H:H, "Completed")
SUMIF and SUMIFS
Sum numbers based on conditions.=SUMIF(range_to_check, criteria, range_to_sum)
Example: Total cost of all Design tasks
=SUMIF(C:C, "Design", J:J)
IF Statements
Make logical decisions.=IF(logical_test, value_if_true, value_if_false)
Example: Flag overdue tasks
=IF(F2
Nested IF for multiple conditions:
=IF(H2="Completed", "Done", IF(F2
VLOOKUP
Look up information from another table.=VLOOKUP(lookup_value, table_array, column_index, FALSE)
Example: You have a separate table with team member contact info. Look up email based on name.
=VLOOKUP(D2, ContactSheet!A:B, 2, FALSE)
This finds the value in D2 (person's name) in the first column of the ContactSheet range A:B, and returns the value from the 2nd column (email).
NETWORKDAYS
Calculate working days between two dates, excluding weekends.=NETWORKDAYS(start_date, end_date, [holidays])
Example:
=NETWORKDAYS(E2, F2)
You can optionally specify holidays by referencing a range of holiday dates.
TEXT
Format dates or numbers as text.=TEXT(value, format_code)
Example: Show month name from a date
=TEXT(E2, "MMMM")
Returns "March" if E2 contains a March date.
Useful for grouping tasks by month in reports.
Key Terms Recap
- Project Tracking - The systematic process of monitoring tasks, timelines, resources, and budgets to ensure a project stays on course toward its goals
- Reporting - Communicating project status, progress, and problems to stakeholders through summaries, dashboards, and visualizations
- Task - A specific, actionable piece of work that contributes to project completion, typically sized to take between a few hours and two weeks
- Status - The current state of a task, commonly categorized as Not Started, In Progress, On Hold, Completed, or Cancelled
- RAG Status - A traffic light system (Red, Amber/Yellow, Green) indicating risk level: Red = at risk or blocked, Amber = minor issues, Green = on track
- Gantt Chart - A horizontal bar chart showing tasks plotted against a timeline, making it easy to visualize schedules, durations, and overlaps
- Dashboard - A visual summary page displaying key project metrics through charts, graphs, and indicators for quick stakeholder understanding
- Variance - The difference between estimated and actual values (cost, time, etc.); positive variance in cost means overspending
- Data Validation - An Excel feature that restricts what users can enter in a cell, creating dropdown lists or enforcing data types to prevent errors
- Conditional Formatting - Automatically changing cell appearance (color, font, etc.) based on cell values, useful for highlighting overdue tasks or budget issues
- PivotTable - An Excel tool that summarizes large datasets dynamically, allowing you to analyze data by different categories without rewriting formulas
- Duration - The time span from task start to task completion, typically measured in days or hours
- Stakeholder - Anyone with an interest in or influence over the project, including sponsors, clients, team members, and end users
- SUMIF - An Excel function that adds numbers in a range based on a specified condition
- COUNTIF - An Excel function that counts how many cells in a range meet a specified condition
- TODAY() - An Excel function that returns the current date and updates automatically each day
- NETWORKDAYS - An Excel function that calculates the number of working days between two dates, excluding weekends and optionally holidays
Common Mistakes and Misconceptions
Mistake: Creating an Overly Complex Tracker from the Start
Why it's wrong: Beginners often try to track everything-task dependencies, risk scores, multiple approval levels, hourly time logs, resource allocation percentages. The result is a spreadsheet so complicated no one uses it. Correct approach: Start simple with just Task, Owner, Dates, and Status. Add complexity gradually only when you've proven you need it and will maintain it.Misconception: The Tracker Should Look Beautiful
Why it's wrong: While visual appeal helps, spending hours on colors, fonts, and decorative elements doesn't make the tracker more functional. Function trumps form. Correct approach: Keep formatting minimal and purposeful. Use color only for conditional alerts (red for overdue, green for complete) and clear section headers. Clarity beats decoration.Mistake: Not Updating the Tracker Regularly
Why it's wrong: A tracker filled with week-old data is useless for decision-making. It becomes a historical record rather than a management tool. Correct approach: Establish and enforce a regular update schedule (e.g., every Monday and Thursday by 5pm). Make tracker updates part of team routine, like stand-up meetings.Misconception: Excel Formulas Are Too Hard for Beginners
Why it's wrong: While advanced formulas exist, the basics (SUM, COUNT, IF, simple arithmetic) are straightforward and cover 80% of project tracking needs. Correct approach: Start with simple formulas like=F2-E2 for duration. Learn one new formula per week. Don't let formula fear prevent you from automating basic calculations.
Mistake: Treating Due Date and Actual Completion Date as the Same
Why it's wrong: Conflating planned vs. actual dates makes it impossible to measure schedule performance or learn from past estimates. Correct approach: Always maintain separate columns for Due Date (planned) and Actual Completion Date. Analyze the difference to improve future estimates.Misconception: Everyone Needs to See All Project Details
Why it's wrong: Executives don't need task-level details; team members don't need budget summaries meant for finance. One-size-fits-all reporting wastes everyone's time. Correct approach: Create different views or reports for different audiences. Use filtering, separate sheets, or different files to show each stakeholder only what they need.Mistake: Ignoring Task Dependencies
Why it's wrong: If Task B can't start until Task A finishes, but your tracker doesn't capture this relationship, you'll schedule them incorrectly and waste time. Correct approach: Add a "Predecessor" or "Depends On" column referencing Task IDs that must finish first. Adjust start dates accordingly.Misconception: Excel Can't Handle "Real" Projects
Why it's wrong: While Excel has limits, many successful projects with hundreds of tasks and millions in budget have been managed with Excel. NASA, Fortune 500 companies, and nonprofits all use it for certain projects. Correct approach: Understand Excel's strengths (flexibility, familiarity, calculation power) and limitations (collaboration, automation, scalability). Choose it when appropriate, upgrade when necessary.Summary
- Excel is a powerful, accessible tool for project tracking that combines data organization, automatic calculations, and visual reporting without requiring expensive specialized software or extensive training.
- A functional project tracker captures five dimensions: task breakdown, timeline/dates, responsibility/ownership, status, and budget/costs-each requiring dedicated columns with appropriate formulas.
- Formulas automate calculations and reduce errors-use simple functions like SUM, COUNTIF, SUMIF, and IF statements to calculate durations, completion rates, budget variance, and status flags automatically.
- Visual tools like Gantt charts and dashboards transform data into insights that stakeholders can understand quickly, using bar charts, conditional formatting, and summary metrics rather than raw data tables.
- Data validation and conditional formatting prevent errors and highlight problems by restricting user input to valid choices and automatically color-coding cells based on conditions like overdue dates or overspent budgets.
- Different stakeholders need different views of the same data-executives want high-level summaries, teams need operational details, and clients require progress narratives with key milestones.
- Regular updates are non-negotiable-a project tracker only provides value when it reflects current reality, requiring disciplined team habits and scheduled update routines.
- Templates provide excellent starting points but should be customized to your specific project needs, industry requirements, and team workflows rather than used as-is.
- Excel has practical limits-around 200-300 tasks, 5-10 active collaborators, and projects where real-time integration with other systems isn't critical; beyond these, consider dedicated project management platforms.
- Start simple and add complexity gradually-the best tracker is one people actually use, which means beginning with essential columns and formulas, then expanding only when proven necessary and maintainable.
Practice Questions
Question 1 (Recall)
What is the difference between a task's Due Date and Actual Completion Date, and why should you track both in a project tracker?Question 2 (Application)
You're managing a website redesign project with 45 tasks. The tracker shows 12 tasks are Completed, 8 are In Progress, 3 are On Hold, and 22 are Not Started. Write the Excel formula you would use to calculate the completion percentage.Question 3 (Application)
Your project tracker has Task Names in column B, Assigned To names in column D, and Estimated Cost in column J. Write a formula that calculates the total estimated cost for all tasks assigned to "Maria."Question 4 (Analytical)
A project manager shares a dashboard showing 85% of tasks complete but also shows the project is 30% over budget and 2 weeks behind schedule. Explain how all three conditions can be true simultaneously and what this might indicate about the project's health.Question 5 (Analytical)
You've built an Excel tracker for a 6-month project with 150 tasks and 8 team members. After 2 months, you notice team members frequently forget to update their task statuses, and when they do update, they often enter inconsistent status values like "done," "finished," "complete," and "closed" instead of the standard "Completed." Describe two specific Excel features you would implement to solve each of these problems, and explain exactly how you would set them up.
The document Excel for Project Tracking and Reporting is a part of the Product & Project Management Course The Project Management Course: Beginner to Project Manager.
All you need of Product & Project Management at this link: Product & Project Management
About this Document

Apr 18, 2026
Last updated
Related Exams
Document Description: Excel for Project Tracking and Reporting for Product & Project Management 2026 is part of The Project Management Course: Beginner to Project Manager preparation.
The notes and questions for Excel for Project Tracking and Reporting have been prepared according to the Product & Project Management exam syllabus. Information about Excel for Project Tracking and Reporting covers topics
like and Excel for Project Tracking and Reporting Example, for Product & Project Management 2026 Exam. Find important definitions, questions, notes, meanings, examples, exercises and tests below for Excel for Project Tracking and Reporting.
Introduction of Excel for Project Tracking and Reporting in English is available as part of our The Project Management Course: Beginner to Project Manager
for Product & Project Management & Excel for Project Tracking and Reporting in Hindi for The Project Management Course: Beginner to Project Manager course.
Download more important topics related with notes, lectures and mock test series for Product & Project Management
Exam by signing up for free. Product & Project Management: Excel for Project Tracking and Reporting
Description
Excel for Project Tracking & Reporting of The Project Management Course covers all the important topics, helping you prepare for the Product & Project Management exam on EduRev.
Information about Excel for Project Tracking and Reporting
In this doc you can find the meaning of Excel for Project Tracking and Reporting defined & explained in the simplest way possible. Besides explaining types of
Excel for Project Tracking and Reporting theory, EduRev gives you an ample number of questions to practice Excel for Project Tracking and Reporting tests, examples and also practice Product & Project Management
tests

|
Explore Courses for Product & Project Management exam
|
|

|
Get EduRev Notes directly in your Google search
|
|
Related Searches
Viva Questions, study material, mock tests for examination, past year papers, practice quizzes, ppt, MCQs, Important questions, video lectures, Free, Excel for Project Tracking and Reporting, pdf , Summary, Extra Questions, Excel for Project Tracking and Reporting, Sample Paper, Semester Notes, shortcuts and tricks, Previous Year Questions with Solutions, Excel for Project Tracking and Reporting, Objective type Questions, Exam;