Practice Questions :Heredity

SECTION I: MULTIPLE CHOICE
Directions
Answer the following 20 questions. Each question has four answer choices (A-D). Select the one best answer for each question unless otherwise directed. Some questions may instruct you to select TWO answers; these questions require both correct responses for credit.
Question 1
A researcher crosses two heterozygous pea plants (Tt × Tt) where T represents the dominant tall allele and t represents the recessive short allele. Among 80 offspring, 55 are tall and 25 are short. To determine whether the observed results differ significantly from the expected Mendelian ratio, which statistical test should be used and what is the correct null hypothesis?
- Chi-square test; the null hypothesis states that there is a significant difference between observed and expected frequencies
- Chi-square test; the null hypothesis states that there is no significant difference between observed and expected frequencies
- Hardy-Weinberg equilibrium test; the null hypothesis states that allele frequencies are constant across generations
- T-test; the null hypothesis states that the mean height of offspring equals the mean height of parents
Question 2
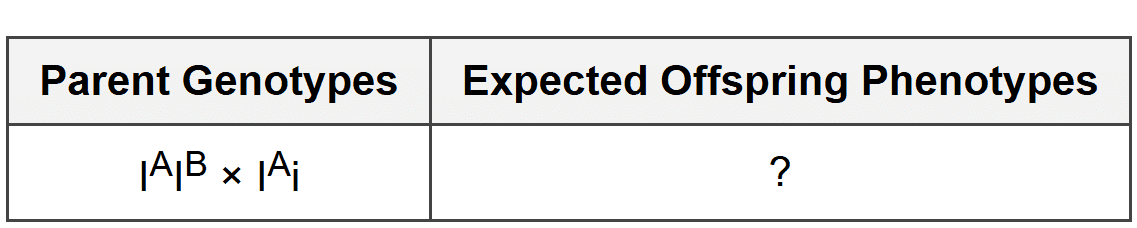
What are the expected phenotypic ratios for offspring from the cross shown above?
- 1 type A : 1 type B : 1 type AB : 1 type O
- 1 type A : 1 type AB : 1 type B : 1 type O
- 2 type A : 1 type AB : 1 type B
- 3 type A : 1 type B
Question 3
In a population of wildflowers, the allele for red petals (R) is incompletely dominant over the allele for white petals (r). Heterozygous individuals (Rr) have pink petals. If a population consists of 36% red flowers, 48% pink flowers, and 16% white flowers, what is the frequency of the R allele in this population?
- 0.36
- 0.48
- 0.60
- 0.84
Question 4
A three-generation pedigree shows the inheritance pattern of a genetic condition. Generation I includes an unaffected male and an unaffected female. Generation II includes four children: two unaffected males, one affected male, and one unaffected female. Generation III shows that the unaffected female from Generation II (who married an unaffected male) has two children: one affected daughter and one unaffected son.
Based on the pedigree in Figure 1, what is the most likely mode of inheritance for this genetic condition?
- Autosomal dominant
- Autosomal recessive
- X-linked recessive
- X-linked dominant
Question 5
During meiosis I, homologous chromosomes pair up and may exchange segments through crossing over. Which of the following best explains the evolutionary significance of crossing over?
- It ensures that each gamete receives exactly half the number of chromosomes as the parent cell
- It increases genetic variation by creating new combinations of alleles on the same chromosome
- It prevents nondisjunction by ensuring proper chromosome alignment during metaphase I
- It repairs DNA damage that occurs during chromosome replication in S phase
Question 6
A diploid organism has a genome size of 2n = 8. How many different combinations of chromosomes are possible in gametes produced by this organism, assuming no crossing over occurs?
- 4
- 8
- 16
- 32
Question 7
A researcher performs a dihybrid cross between two fruit flies heterozygous for body color (B = gray, b = black) and wing length (V = normal, v = vestigial). The expected 9:3:3:1 ratio predicts 562.5 gray/normal, 187.5 gray/vestigial, 187.5 black/normal, and 62.5 black/vestigial offspring out of 1000 total. The observed results are:
- Gray body, normal wings: 575
- Gray body, vestigial wings: 45
- Black body, normal wings: 42
- Black body, vestigial wings: 338
Which conclusion is best supported by the observed data?
- The genes assort independently and follow Mendel's law of independent assortment
- The genes are linked on the same chromosome and do not assort independently
- One of the genes exhibits incomplete dominance
- Both genes are located on the X chromosome
Question 8
Select TWO answers. Which of the following statements correctly describe the outcome of nondisjunction during meiosis?
- If nondisjunction occurs during meiosis I, all four resulting gametes will have abnormal chromosome numbers
- If nondisjunction occurs during meiosis II, only two of the four resulting gametes will have abnormal chromosome numbers
- Nondisjunction always results in gametes with one extra chromosome (n + 1)
- Fertilization involving a gamete affected by nondisjunction can result in offspring with trisomy or monosomy
Question 9
In humans, the SRY gene located on the Y chromosome triggers male sexual development. In rare cases, a portion of the Y chromosome containing the SRY gene becomes attached to an X chromosome through chromosomal translocation. What would be the expected phenotype of an individual with karyotype 46, XX who has the SRY gene on one X chromosome?
- Female, because the individual has two X chromosomes
- Male, because the SRY gene is present and can initiate male development
- Intersex, with some male and some female characteristics in equal proportion
- The individual would not survive due to the chromosomal abnormality
Question 10
In a population of 1000 individuals, 360 display the recessive phenotype for a particular trait controlled by a single gene with two alleles. Assume the population is in Hardy-Weinberg equilibrium.
What is the expected number of heterozygous individuals in this population?
- 160
- 320
- 480
- 640
Question 11
A mutation in a gene encoding a DNA mismatch repair enzyme causes the enzyme to be nonfunctional. Which of the following is the most likely consequence of this mutation for the organism?
- Decreased rate of crossing over during meiosis
- Increased frequency of mutations passed to offspring
- Inability to replicate DNA during S phase
- Complete sterility due to failure of gamete production
Question 12
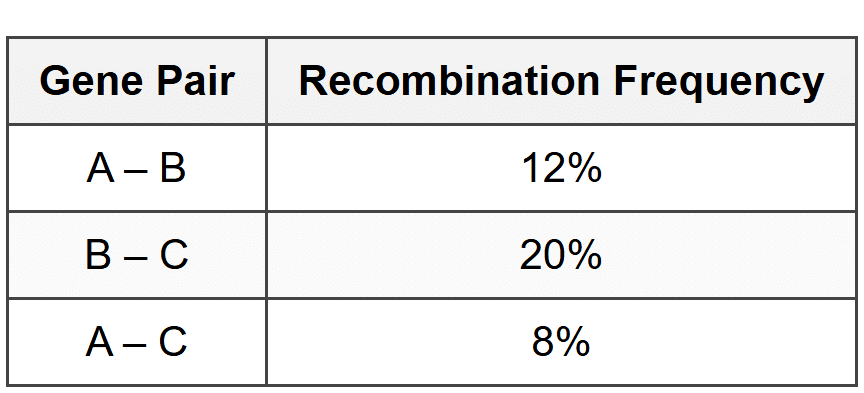
Based on the recombination frequencies shown in Figure 2, what is the correct order of genes A, B, and C on the chromosome?
- A - B - C
- A - C - B
- B - A - C
- C - B - A
Question 13
Sickle cell anemia is caused by a point mutation in the gene encoding the β-globin subunit of hemoglobin, where glutamic acid is replaced by valine at position 6. Individuals who are heterozygous for the sickle cell allele (HbA/HbS) have some protection against malaria. In regions where malaria is endemic, the frequency of the HbS allele can be as high as 0.2, despite the fact that homozygous individuals (HbS/HbS) often die before reproductive age. This is an example of which evolutionary mechanism?
- Genetic drift
- Gene flow
- Heterozygote advantage (balanced selection)
- Directional selection against the dominant allele
Question 14
Select TWO answers. Which TWO of the following conditions are required for a population to be in Hardy-Weinberg equilibrium?
- No mutations occur in the gene pool
- Individuals preferentially mate with others of similar genotype
- The population experiences immigration from other populations
- The population is large enough that genetic drift has minimal effect
Question 15
A researcher studies coat color in mice, which is determined by two genes. Gene A controls pigment deposition (A = pigment deposited, a = no pigment/albino), and Gene B controls pigment color (B = black, b = brown). The genes are on different chromosomes. The researcher crosses two mice with genotype AaBb and obtains the following results among 160 offspring:
- Black coat: 90
- Brown coat: 30
- Albino (white) coat: 40
What phenotypic ratio do the observed results most closely approximate?
- 9:3:3:1
- 9:3:4
- 12:3:1
- 9:7
Question 16
Genomic imprinting is an epigenetic phenomenon in which certain genes are expressed in a parent-of-origin-specific manner. For example, the IGF2 gene (insulin-like growth factor 2) in humans is expressed only from the paternally inherited allele, while the maternally inherited allele is silenced by methylation. Which of the following predictions is most consistent with this pattern of inheritance?
- A loss-of-function mutation in the paternal IGF2 allele would have no effect on offspring phenotype because the maternal allele would compensate
- A loss-of-function mutation in the paternal IGF2 allele would result in loss of IGF2 expression in offspring
- Both maternal and paternal IGF2 alleles must be mutated to affect offspring phenotype
- Genomic imprinting prevents all expression of IGF2 in offspring regardless of parental genotype
Question 17
A line graph shows the frequency of two alleles (A and a) in a population over 50 generations. At generation 0, both alleles have a frequency of 0.5. By generation 50, allele A has a frequency of 0.95 and allele a has a frequency of 0.05. The graph shows a consistent directional trend with allele A increasing and allele a decreasing over time.
Which of the following scenarios best explains the pattern shown in the graph?
- Random mating and no selection are occurring; the change is due to genetic drift alone
- Individuals with genotype AA have higher fitness than individuals with genotype aa, and directional selection favors allele A
- The population is experiencing bottleneck effects every 10 generations
- Heterozygous individuals (Aa) have lower fitness than both homozygous genotypes
Question 18
In Labrador retrievers, coat color is determined by two genes. Gene E controls pigment deposition (E allows deposition, e prevents it), and Gene B controls color (B = black, b = brown). Dogs with genotype ee are yellow regardless of their B genotype. This is an example of:
- Codominance
- Incomplete dominance
- Epistasis
- Pleiotropy
Question 19
Polyploidy, the condition of having more than two complete sets of chromosomes, is relatively common in plants but rare in animals. Which of the following best explains why polyploidy is more often lethal in animals than in plants?
- Animal cells cannot undergo mitosis with additional chromosome sets, while plant cells can
- Animals have sex chromosome systems that become imbalanced with additional chromosome sets, disrupting sex determination and development
- Plant cells have cell walls that can accommodate larger nuclei, while animal cells cannot
- Animals require more energy than plants and cannot support the metabolic demands of additional chromosomes
Question 20
A researcher analyzing three linked genes (D, E, and F) on the same chromosome calculates the following recombination frequencies:
- D and E: 15 map units
- E and F: 7 map units
- D and F: 22 map units
In a cross involving these three genes, what is the expected frequency of double crossover events between genes D and F?
- 0.105% (0.0105)
- 1.05% (0.0105)
- 10.5% (0.105)
- 15.0% (0.15)
SECTION II: FREE RESPONSE
Directions
Answer both of the following questions. Write your response in essay form. Answers must be written out in paragraph or structured format; outlines or bulleted lists alone are not acceptable. It is recommended that you spend approximately 20 minutes on Question 1 and 10 minutes on Question 2.
FRQ 1 (Long Free Response - 10 points)
Fruit flies (Drosophila melanogaster) are a model organism commonly used to study heredity. A researcher investigates two traits in fruit flies: eye color and wing shape. Wild-type flies have red eyes (E) and normal wings (W). The mutant alleles produce white eyes (e) and vestigial wings (w). Both genes are located on autosomes.
The researcher performs a dihybrid cross by mating two flies that are heterozygous for both traits (EeWw × EeWw). Among 1600 offspring, the researcher observes the following distribution:
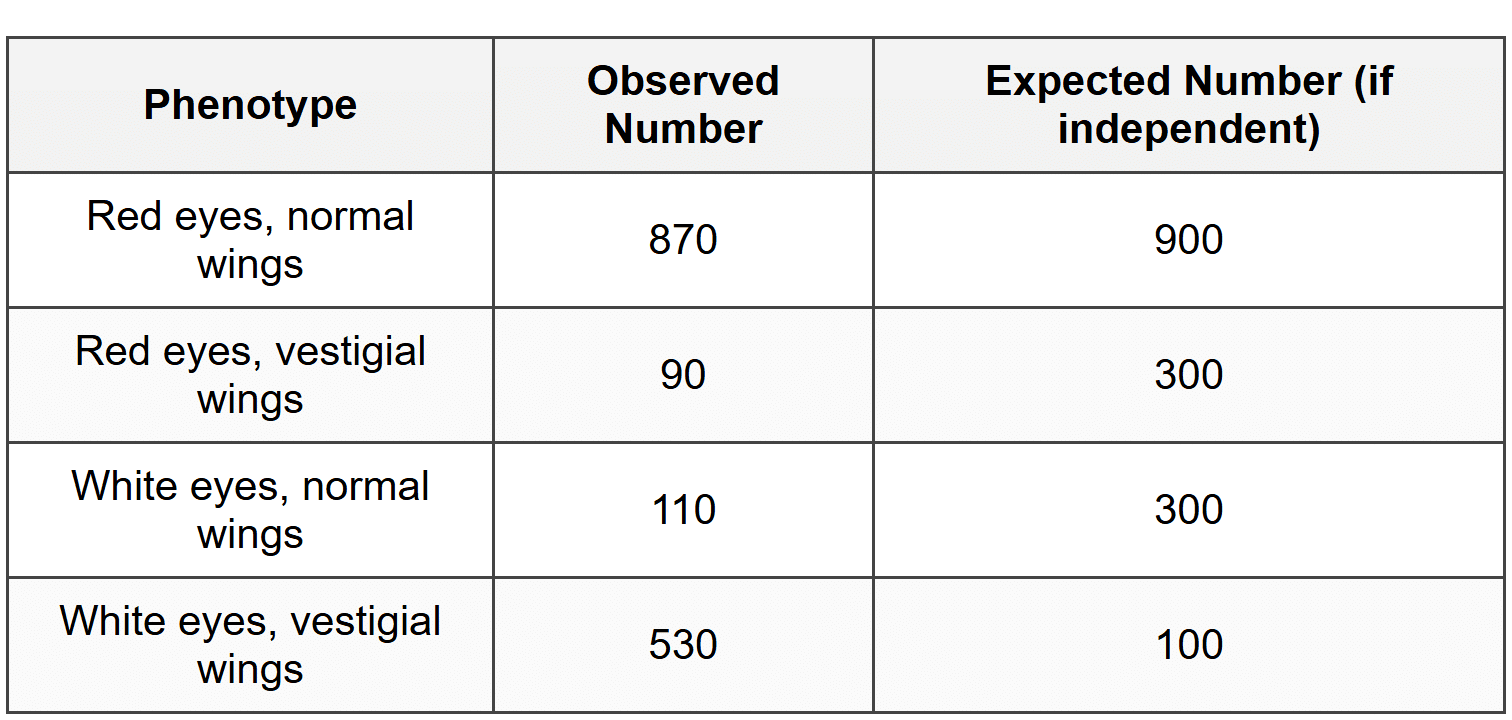
The chi-square value calculated from this data is χ² = 1440. The critical value for χ² at 3 degrees of freedom and p = 0.05 is 7.81.
- Identify the expected phenotypic ratio if the two genes assort independently according to Mendel's law of independent assortment.
- Calculate the recombination frequency (in map units) between the eye color gene and the wing shape gene. Show your work.
- Explain what the chi-square analysis indicates about whether the two genes assort independently. Use specific evidence from the data provided.
- Describe an experimental procedure to determine the precise chromosomal location of the eye color gene using polytene chromosome analysis in Drosophila salivary glands.
- Predict how the observed phenotypic ratios would differ if the two genes were located on the same chromosome with no crossing over occurring between them. Justify your prediction.
- Explain how the process of crossing over during meiosis contributes to genetic diversity and has implications for evolution by natural selection.
FRQ 2 (Short Free Response - 4 points)
The pedigree below shows the inheritance of cystic fibrosis, a recessive genetic disorder, across three generations in a family. Affected individuals are shown with filled symbols.
Pedigree Description:
- Generation I: Individual I-1 (male, unaffected) and Individual I-2 (female, unaffected) have four children.
- Generation II: Individual II-1 (male, unaffected), Individual II-2 (male, affected), Individual II-3 (female, unaffected), and Individual II-4 (male, unaffected).
- Generation III: Individual II-3 married an unaffected male (II-5) and they have three children: Individual III-1 (female, unaffected), Individual III-2 (male, affected), and Individual III-3 (female, unaffected).
Use the following notation: C = normal allele, c = cystic fibrosis allele.
- Determine the genotypes of Individual I-1 and Individual I-2. Explain your reasoning using evidence from the pedigree.
- Calculate the probability that Individual III-1 is a carrier (heterozygous) for the cystic fibrosis allele. Show your work and explain each step.
- Describe how a genetic counselor could use DNA testing to confirm whether Individual III-1 is a carrier, and explain one advantage of this information for family planning.
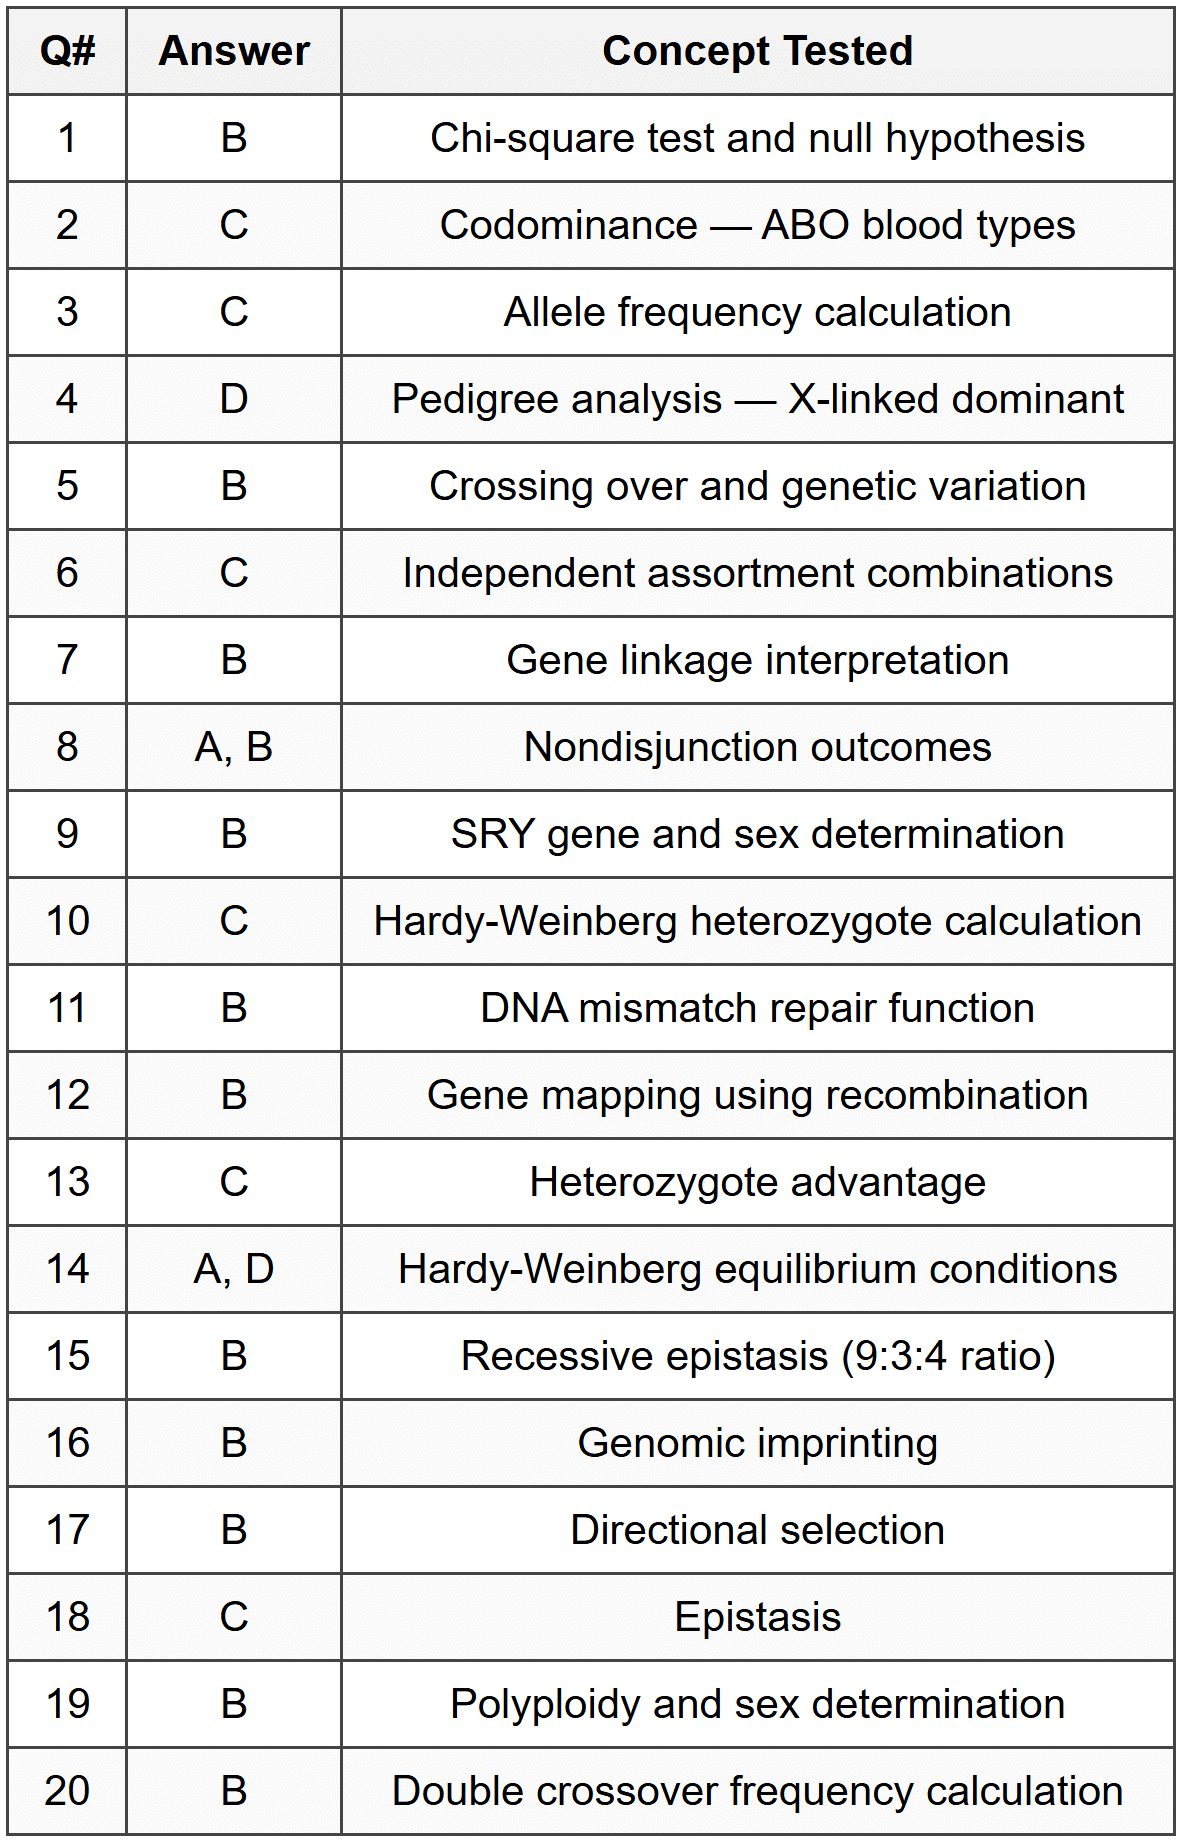
ANSWER KEY
Part A - Multiple Choice Answer Table
Part B - FRQ Detailed Answers
FRQ 1 - Answer Key
Part A: Identify the expected phenotypic ratio
The expected phenotypic ratio if the two genes assort independently is 9:3:3:1. This ratio represents 9 red eyes/normal wings : 3 red eyes/vestigial wings : 3 white eyes/normal wings : 1 white eyes/vestigial wings. This classic Mendelian dihybrid ratio occurs when two heterozygous genes on different chromosomes assort independently during gamete formation.
Part B: Calculate the recombination frequency
Step 1: Identify parental and recombinant phenotypes.
Based on the observed data, the most frequent phenotypes are red eyes/normal wings (870) and white eyes/vestigial wings (530). These are the parental types (total = 1400).
The least frequent phenotypes are red eyes/vestigial wings (90) and white eyes/normal wings (110). These are the recombinant types (total = 200).
Step 2: Calculate recombination frequency.
Recombination frequency = (number of recombinants / total offspring) × 100%
Recombination frequency = (200 / 1600) × 100%
Recombination frequency = 0.125 × 100%
Recombination frequency = 12.5% or 12.5 map units
Part C: Explain what the chi-square analysis indicates
The chi-square analysis indicates that the two genes do not assort independently. The calculated chi-square value of χ² = 1440 is far greater than the critical value of 7.81 at p = 0.05 with 3 degrees of freedom. This means we reject the null hypothesis of independent assortment. The probability that the observed deviation from the expected 9:3:3:1 ratio occurred by chance alone is less than 0.05 (very unlikely). The large chi-square value indicates the genes are linked on the same chromosome, which explains why the parental phenotype combinations (red/normal and white/vestigial) appear far more frequently than expected, and the recombinant phenotypes appear far less frequently than expected under independent assortment.
Part D: Describe an experimental procedure using polytene chromosomes
An ideal answer must include the following components:
- Sample preparation: Dissect salivary glands from Drosophila larvae (third instar stage) because these cells contain polytene chromosomes with distinct visible banding patterns.
- Chromosome staining: Fix the tissue and stain the chromosomes with a DNA-binding dye such as aceto-orcein or DAPI to visualize the banding pattern.
- In situ hybridization: Use fluorescent in situ hybridization (FISH) with a labeled DNA probe complementary to the eye color gene sequence. The probe will bind to the specific chromosomal location where the gene is located.
- Microscopy and mapping: View the chromosomes under a fluorescence microscope to identify which chromosome and which band location shows fluorescent signal, thereby determining the precise cytological location of the eye color gene.
Part E: Predict phenotypic ratios with complete linkage
If the two genes were completely linked (on the same chromosome with no crossing over), the phenotypic ratio would be 1:1:1:1 in a testcross, or in a dihybrid cross as shown, the ratio would be approximately 3:1:1:3 or only parental types in a 3:1 ratio overall. More specifically, in the EeWw × EeWw cross with complete linkage, if the parental chromosomes carry E-W together and e-w together, the offspring would show a ratio closer to 3 red/normal : 1 white/vestigial, with essentially no recombinant phenotypes (red/vestigial and white/normal). This differs dramatically from the observed 870:90:110:530 ratio because complete linkage eliminates recombinant classes entirely, whereas the observed data show that crossing over does occur 12.5% of the time, producing some recombinant offspring.
Part F: Explain crossing over's contribution to genetic diversity and evolution
Crossing over during prophase I of meiosis physically exchanges segments of DNA between homologous chromosomes, creating new combinations of alleles that did not exist in either parent. This process increases genetic variation in gametes beyond what independent assortment alone provides. Without crossing over, all alleles on the same chromosome would always be inherited together as a linked unit. By creating recombinant chromosomes, crossing over generates offspring with novel genotypic combinations. This genetic diversity provides the raw material for natural selection: when environmental conditions change, populations with greater genetic variation have a higher probability of containing individuals with favorable trait combinations that increase survival and reproduction. Over time, natural selection can act on this variation to increase the frequency of beneficial allele combinations in the population, driving evolutionary change and adaptation.
FRQ 2 - Answer Key
Part A: Determine the genotypes of I-1 and I-2
Both Individual I-1 and Individual I-2 must have the genotype Cc (heterozygous carriers). The reasoning is as follows: Individual II-2 is affected with cystic fibrosis, which means this individual has genotype cc (homozygous recessive). To have a cc child, both parents must have contributed a c allele. Since both I-1 and I-2 are unaffected (they do not have cystic fibrosis), they cannot be cc themselves-they must be Cc. Each parent is a carrier who passed one recessive allele to their affected son while remaining phenotypically normal due to the presence of one dominant C allele.
Part B: Calculate the probability that III-1 is a carrier
Step 1: Determine the genotype of Individual II-3.
Individual II-3 is unaffected but has two carrier parents (I-1 and I-2, both Cc). The possible genotypes for II-3 are: CC, Cc, or cc with probabilities 1/4, 1/2, and 1/4 respectively. However, since II-3 is unaffected (not cc), we can eliminate the cc possibility. Among only unaffected offspring, the probability that II-3 is CC is 1/3, and the probability that II-3 is Cc is 2/3.
Step 2: Determine the genotype of Individual II-5.
No information suggests II-5 is related to this family or is a carrier. Assuming II-5 comes from the general population where carrier frequency is low, we assume II-5 is CC (homozygous normal).
Step 3: Determine possible genotypes for III-1.
If II-3 is CC and II-5 is CC → all children are CC (probability 1/3 × 1 = 1/3)
If II-3 is Cc and II-5 is CC → children are 1/2 CC and 1/2 Cc (probability 2/3 × 1 = 2/3)
Step 4: Calculate the probability that III-1 is Cc.
P(III-1 is Cc) = P(II-3 is Cc) × P(Cc child from Cc × CC cross)
P(III-1 is Cc) = 2/3 × 1/2
P(III-1 is Cc) = 1/3 or approximately 33.3%
Note: If we account for the fact that Individual III-2 is affected (cc), this changes the calculation because it confirms that II-3 must be Cc (not CC). In that case:
Since II-3 must be Cc and II-5 must be Cc (to have an affected child), the probability that III-1 is a carrier is 2/3, because among unaffected children of Cc × Cc, 2 out of 3 are carriers.
Part C: Describe DNA testing and its advantage
A genetic counselor could use DNA sequencing or PCR-based genetic testing to analyze Individual III-1's CFTR gene (the gene responsible for cystic fibrosis). The test would examine both alleles to determine if III-1 carries one normal allele and one mutated allele (carrier status) or has two normal alleles (non-carrier). This is typically done through blood or saliva sample collection, DNA extraction, and targeted sequencing of the CFTR gene region.
One advantage of this information for family planning is that if III-1 is confirmed to be a carrier, she and her partner can undergo genetic counseling to assess the risk of having a child with cystic fibrosis. If her partner is also tested and found to be a carrier, they would have a 25% chance with each pregnancy of having an affected child, and could make informed reproductive decisions including preimplantation genetic diagnosis (PGD), prenatal testing, or other family planning options.


