Practice Questions :Natural Selection

SECTION I: MULTIPLE CHOICE
Directions
Answer the following 20 questions. Each question has four answer choices (A, B, C, D). Select the one best answer unless otherwise instructed. Some questions may instruct you to select two answers; these will be clearly labeled. You may use a calculator where appropriate.
Questions 1-3 refer to the following information:
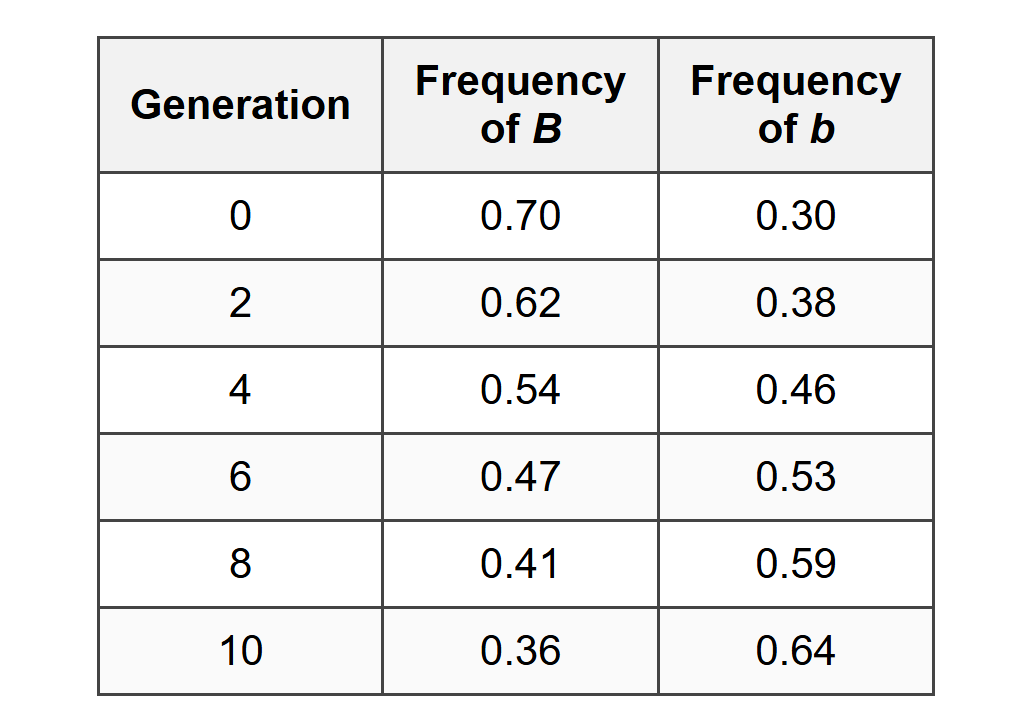
A population of field mice lives in an environment with light-colored soil. Researchers tracked allele frequencies for fur color over 10 generations. Two alleles exist: B (dark fur, dominant) and b (light fur, recessive). Hawks are the primary predator and hunt during daylight hours.
1. Which of the following best explains the change in allele frequencies observed in the mouse population?
- Genetic drift caused random fluctuations in allele frequencies independent of environmental factors.
- Directional selection favored the light fur phenotype because it provided better camouflage against predators.
- Disruptive selection eliminated intermediate phenotypes, leading to two distinct populations.
- Stabilizing selection maintained the existing allele frequencies by favoring heterozygous individuals.
2. Assuming the population is in Hardy-Weinberg equilibrium at generation 10, what is the expected frequency of heterozygous individuals (Bb)?
- 0.13
- 0.23
- 0.46
- 0.64
3. Which modification to the environment would most likely reverse the trend in allele frequencies observed in the data?
- Introduction of a disease that affects all mice equally regardless of fur color
- A volcanic eruption that covers the light soil with dark ash
- An increase in the mouse population size due to abundant food resources
- A decrease in the hawk population due to human hunting
Questions 4-5 refer to the following scenario:
Antibiotic resistance in bacteria is a well-documented example of natural selection in action. A population of Staphylococcus aureus bacteria is exposed to the antibiotic methicillin. Initially, 99.9% of the bacteria are susceptible to the antibiotic, but 0.1% carry a mutation that confers resistance. After several rounds of antibiotic treatment, the resistant strain becomes dominant in the population.
4. Which of the following statements best describes why the resistant bacteria became more common?
- The antibiotic caused mutations in the bacterial DNA, creating resistant strains.
- Bacteria with pre-existing resistance mutations had higher fitness in the presence of the antibiotic.
- The bacteria adapted to the antibiotic through physiological changes within their lifetimes.
- Horizontal gene transfer allowed all bacteria to acquire resistance after antibiotic exposure.
5. SELECT TWO answers. Which of the following conditions are necessary for natural selection to occur in the bacterial population described?
- Variation in antibiotic resistance must exist within the population.
- The population must be large enough to prevent genetic drift.
- The resistance trait must be heritable and passed to offspring.
- Bacteria must reproduce sexually to generate genetic diversity.
6. A population of beetles exhibits variation in shell thickness. Beetles with thicker shells are better protected from bird predators but require more energy to produce the shell. Beetles with thinner shells are more vulnerable to predation but can allocate more energy to reproduction. Which type of selection is most likely acting on this population?
- Directional selection favoring thicker shells
- Stabilizing selection favoring intermediate shell thickness
- Disruptive selection favoring both extremes
- Sexual selection favoring males with thicker shells
Questions 7-8 refer to the following graph:
A population of finches on an isolated island experienced a severe drought. The graph shows the distribution of beak depths before the drought (gray bars) and after the drought (black bars).
[Imagine a histogram showing: Before drought: bell-shaped distribution centered at 9 mm (range 7-11 mm). After drought: distribution shifted right, centered at 10 mm (range 8.5-12 mm), with reduced frequency of small beaks.]
7. Which statement best explains the change in beak depth distribution after the drought?
- Individual finches developed deeper beaks during their lifetimes in response to food scarcity.
- The drought caused mutations that increased beak depth in the surviving finches.
- Finches with deeper beaks had greater survival because they could crack the larger, tougher seeds that remained during the drought.
- Random mating among finches after the drought produced offspring with deeper beaks.
8. If the environmental conditions returned to pre-drought levels and small, soft seeds became abundant again, which of the following would most likely occur over subsequent generations?
- The mean beak depth would remain at 10 mm because traits acquired during the drought are permanently fixed.
- The mean beak depth would decrease as finches with smaller beaks gained a fitness advantage.
- All finches would evolve identical beak sizes through convergent evolution.
- Beak depth would show increased variation due to disruptive selection.
9. In a population of flowers, red color is determined by the dominant allele R and white color by the recessive allele r. A population survey reveals the following: 500 red flowers and 100 white flowers. Assuming Hardy-Weinberg equilibrium, what is the frequency of the R allele?
- 0.17
- 0.33
- 0.59
- 0.83
10. Which of the following is NOT one of the five conditions required for a population to remain in Hardy-Weinberg equilibrium?
- No mutations occur in the gene pool.
- The population is infinitely large to prevent genetic drift.
- All members of the population have equal fitness.
- Individuals mate only with others of similar phenotype.
Questions 11-12 refer to the following information:
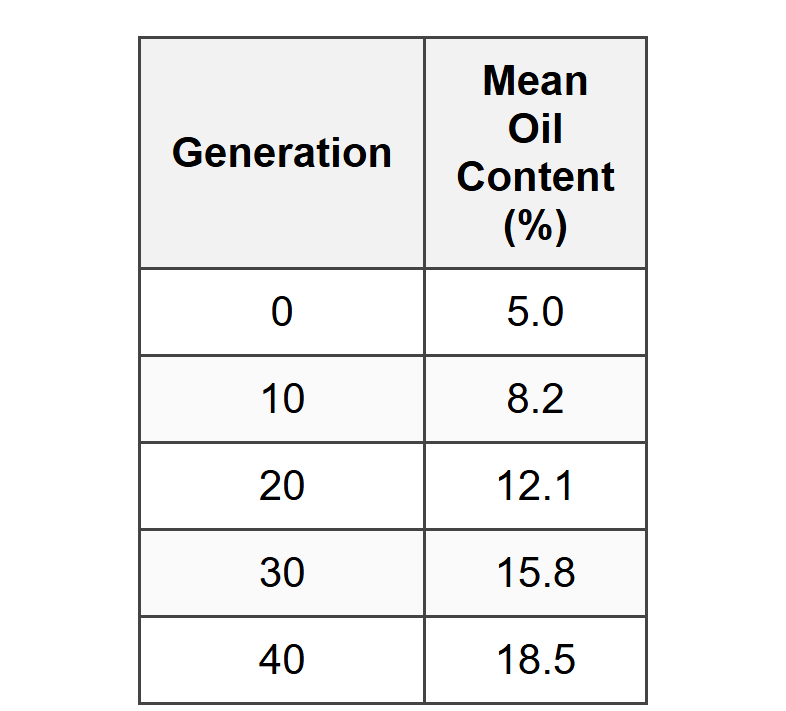
Researchers conducted an artificial selection experiment on maize (corn) plants, selecting for high oil content in kernels. The experiment began with a population having a mean oil content of 5%. Each generation, only the plants with the top 20% oil content were allowed to reproduce.
11. The results of this experiment best demonstrate which of the following concepts?
- Natural selection can produce rapid evolutionary change in response to environmental pressures.
- Heritable variation in a trait allows for selection to change the phenotype distribution in a population.
- Genetic drift is the primary mechanism of evolution in small populations.
- Mutations are required each generation for evolutionary change to occur.
12. If selection were halted after generation 40 and the plants were allowed to mate randomly, which of the following outcomes would most likely occur over the next several generations?
- Oil content would continue to increase due to momentum from previous selection.
- Oil content would remain constant at 18.5% indefinitely.
- Oil content might decrease slightly if high oil content is associated with reduced fitness.
- Oil content would return to the original 5% within five generations.
13. SELECT TWO answers. Which of the following are examples of prezygotic reproductive isolation mechanisms?
- Two species of frogs breed in the same pond but at different times of year.
- Hybrid offspring of two bird species are sterile.
- Two species of insects have incompatible reproductive structures.
- Hybrid embryos of two fish species fail to develop properly and die before birth.
14. In a population of snails, shell color is influenced by multiple genes, and the phenotype shows continuous variation from light yellow to dark brown. The population currently shows a normal distribution centered on medium brown. A new predator that hunts primarily by sight is introduced to the environment and preferentially preys on snails with medium brown shells because they are most common. Which pattern of selection is most likely to occur?
- Directional selection toward darker shells
- Stabilizing selection maintaining medium brown shells
- Disruptive selection favoring both light and dark shells
- Sexual selection favoring darker shells in males only
Questions 15-16 refer to the following scenario:
On an archipelago, each island has a distinct species of lizard. All lizard species share a common ancestor that colonized the islands approximately 2 million years ago. Researchers analyzed morphological traits and found that body size and limb length vary significantly among species in correlation with the vegetation structure on each island. Islands with dense, low shrubs have lizards with shorter limbs, while islands with tall trees have lizards with longer limbs.
15. The pattern described is best explained by which evolutionary process?
- Convergent evolution, where unrelated species evolve similar traits
- Adaptive radiation, where a common ancestor diversifies into multiple species adapted to different environments
- Coevolution, where two species reciprocally influence each other's evolution
- Genetic drift, where random changes in allele frequencies lead to morphological differences
16. Which of the following observations would provide the strongest evidence that the lizard species on different islands are reproductively isolated?
- Lizards from different islands have different diets.
- When brought together in a laboratory, lizards from different islands do not produce viable, fertile offspring.
- Lizards from different islands have different coloration patterns.
- The islands are separated by at least 50 kilometers of ocean.
17. A moth population exhibits two color morphs: light gray and dark gray. In a forested area with light-colored tree bark, 95% of moths are light gray. After decades of industrial pollution darken the tree bark, the population shifts to 70% dark gray moths. This is an example of which phenomenon?
- Artificial selection
- Industrial melanism
- Genetic drift
- Gene flow
18. Which of the following statements correctly describes the relationship between fitness and natural selection?
- Fitness refers to an organism's physical strength and ability to survive predation.
- Fitness is measured by an organism's ability to survive to old age.
- Fitness is determined by the number of fertile offspring an organism produces relative to others in the population.
- Fitness is constant for a species regardless of environmental conditions.
Questions 19-20 refer to the following data:
A population of fish lives in a lake where water temperature varies seasonally. Two alleles exist for a gene encoding a temperature-sensitive enzyme: TH (functions optimally at high temperatures) and TL (functions optimally at low temperatures). Researchers sampled the population and determined genotype frequencies.
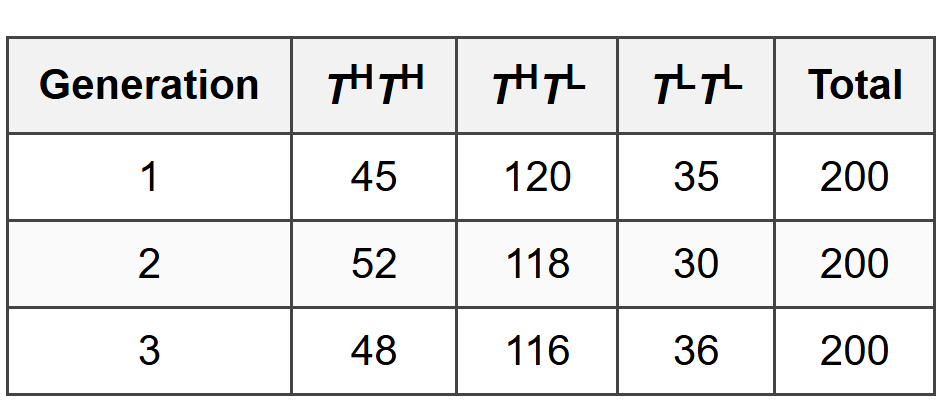
19. Based on the data, which of the following best describes the pattern of selection acting on this population?
- Directional selection favoring the TH allele
- Stabilizing selection favoring heterozygotes
- Disruptive selection favoring both homozygotes
- No consistent pattern of selection; variation is likely due to genetic drift
20. What is the frequency of the TH allele in generation 3?
- 0.24
- 0.48
- 0.53
- 0.58
SECTION II: FREE RESPONSE
Directions
Answer both of the following questions. Responses to these questions should be written in essay form, using complete sentences. You may use diagrams to supplement your answers, but diagrams alone are not sufficient. Show all mathematical work with appropriate units for questions requiring calculations.
FRQ 1 (Long Free Response - 10 points)
Suggested time: 22 minutes
Researchers studied a population of cactus finches (Geospiza scandens) on Daphne Major, a small island in the Galápagos archipelago. They measured beak length in millimeters for all adult finches before and after a severe drought. The finches feed primarily on cactus flowers and seeds, and beak morphology influences feeding efficiency.
Pre-drought data (Year 1):
Mean beak length: 13.2 mm
Standard deviation: 1.8 mm
Population size: 280 individuals
Post-drought data (Year 3):
Mean beak length: 14.1 mm
Standard deviation: 1.5 mm
Population size: 180 individuals
During the drought, small cactus flowers became scarce, but the plants continued to produce large, woody seeds that required substantial force to crack. Researchers hypothesize that natural selection favored finches with longer, stronger beaks during this period.
In addition to field observations, researchers conducted a genetic analysis. They identified a gene, ALX1, associated with beak length. Two alleles exist: AL (associated with longer beaks, dominant) and AS (associated with shorter beaks, recessive). Post-drought genotype frequencies were as follows:
- ALAL: 81 individuals
- ALAS: 72 individuals
- ASAS: 27 individuals
(A) Describe an experimental procedure to test whether beak length affects seed-cracking efficiency. Your procedure should identify the independent variable, dependent variable, and at least two factors that should be held constant.
(B) Using the post-drought genotype data, calculate the observed frequency of the AL allele. Show your work.
(C) Using the Hardy-Weinberg equation, calculate the expected number of individuals with the ALAS genotype if the population were in Hardy-Weinberg equilibrium. Show your work.
(D) The chi-square value comparing observed and expected genotype frequencies is \( \chi^2 = 2.14 \). The critical value at \( p = 0.05 \) with 1 degree of freedom is 3.84. Based on this information, is the population in Hardy-Weinberg equilibrium? Justify your answer.
(E) Explain how the data support the researchers' hypothesis that natural selection occurred during the drought. Include reference to both the change in mean beak length and the genetic data.
(F) Predict what would happen to mean beak length in the finch population if environmental conditions returned to pre-drought levels and small cactus flowers became abundant again. Justify your prediction.
FRQ 2 (Short Free Response - 4 points)
Suggested time: 10 minutes
A hospital treats a patient infected with Mycobacterium tuberculosis using the antibiotic rifampicin. After several weeks of treatment, the infection persists, and laboratory tests reveal that the bacterial population is now resistant to rifampicin. Genetic sequencing shows that the resistant bacteria carry a mutation in the rpoB gene, which encodes a subunit of RNA polymerase.
(A) Identify the mechanism of evolution responsible for the increase in rifampicin-resistant bacteria in this patient.
(B) Explain why the mutation in the rpoB gene increased in frequency during rifampicin treatment. Your explanation should include the concept of differential reproductive success.
(C) Describe one practice that hospitals could implement to reduce the spread of antibiotic-resistant bacteria among patients.
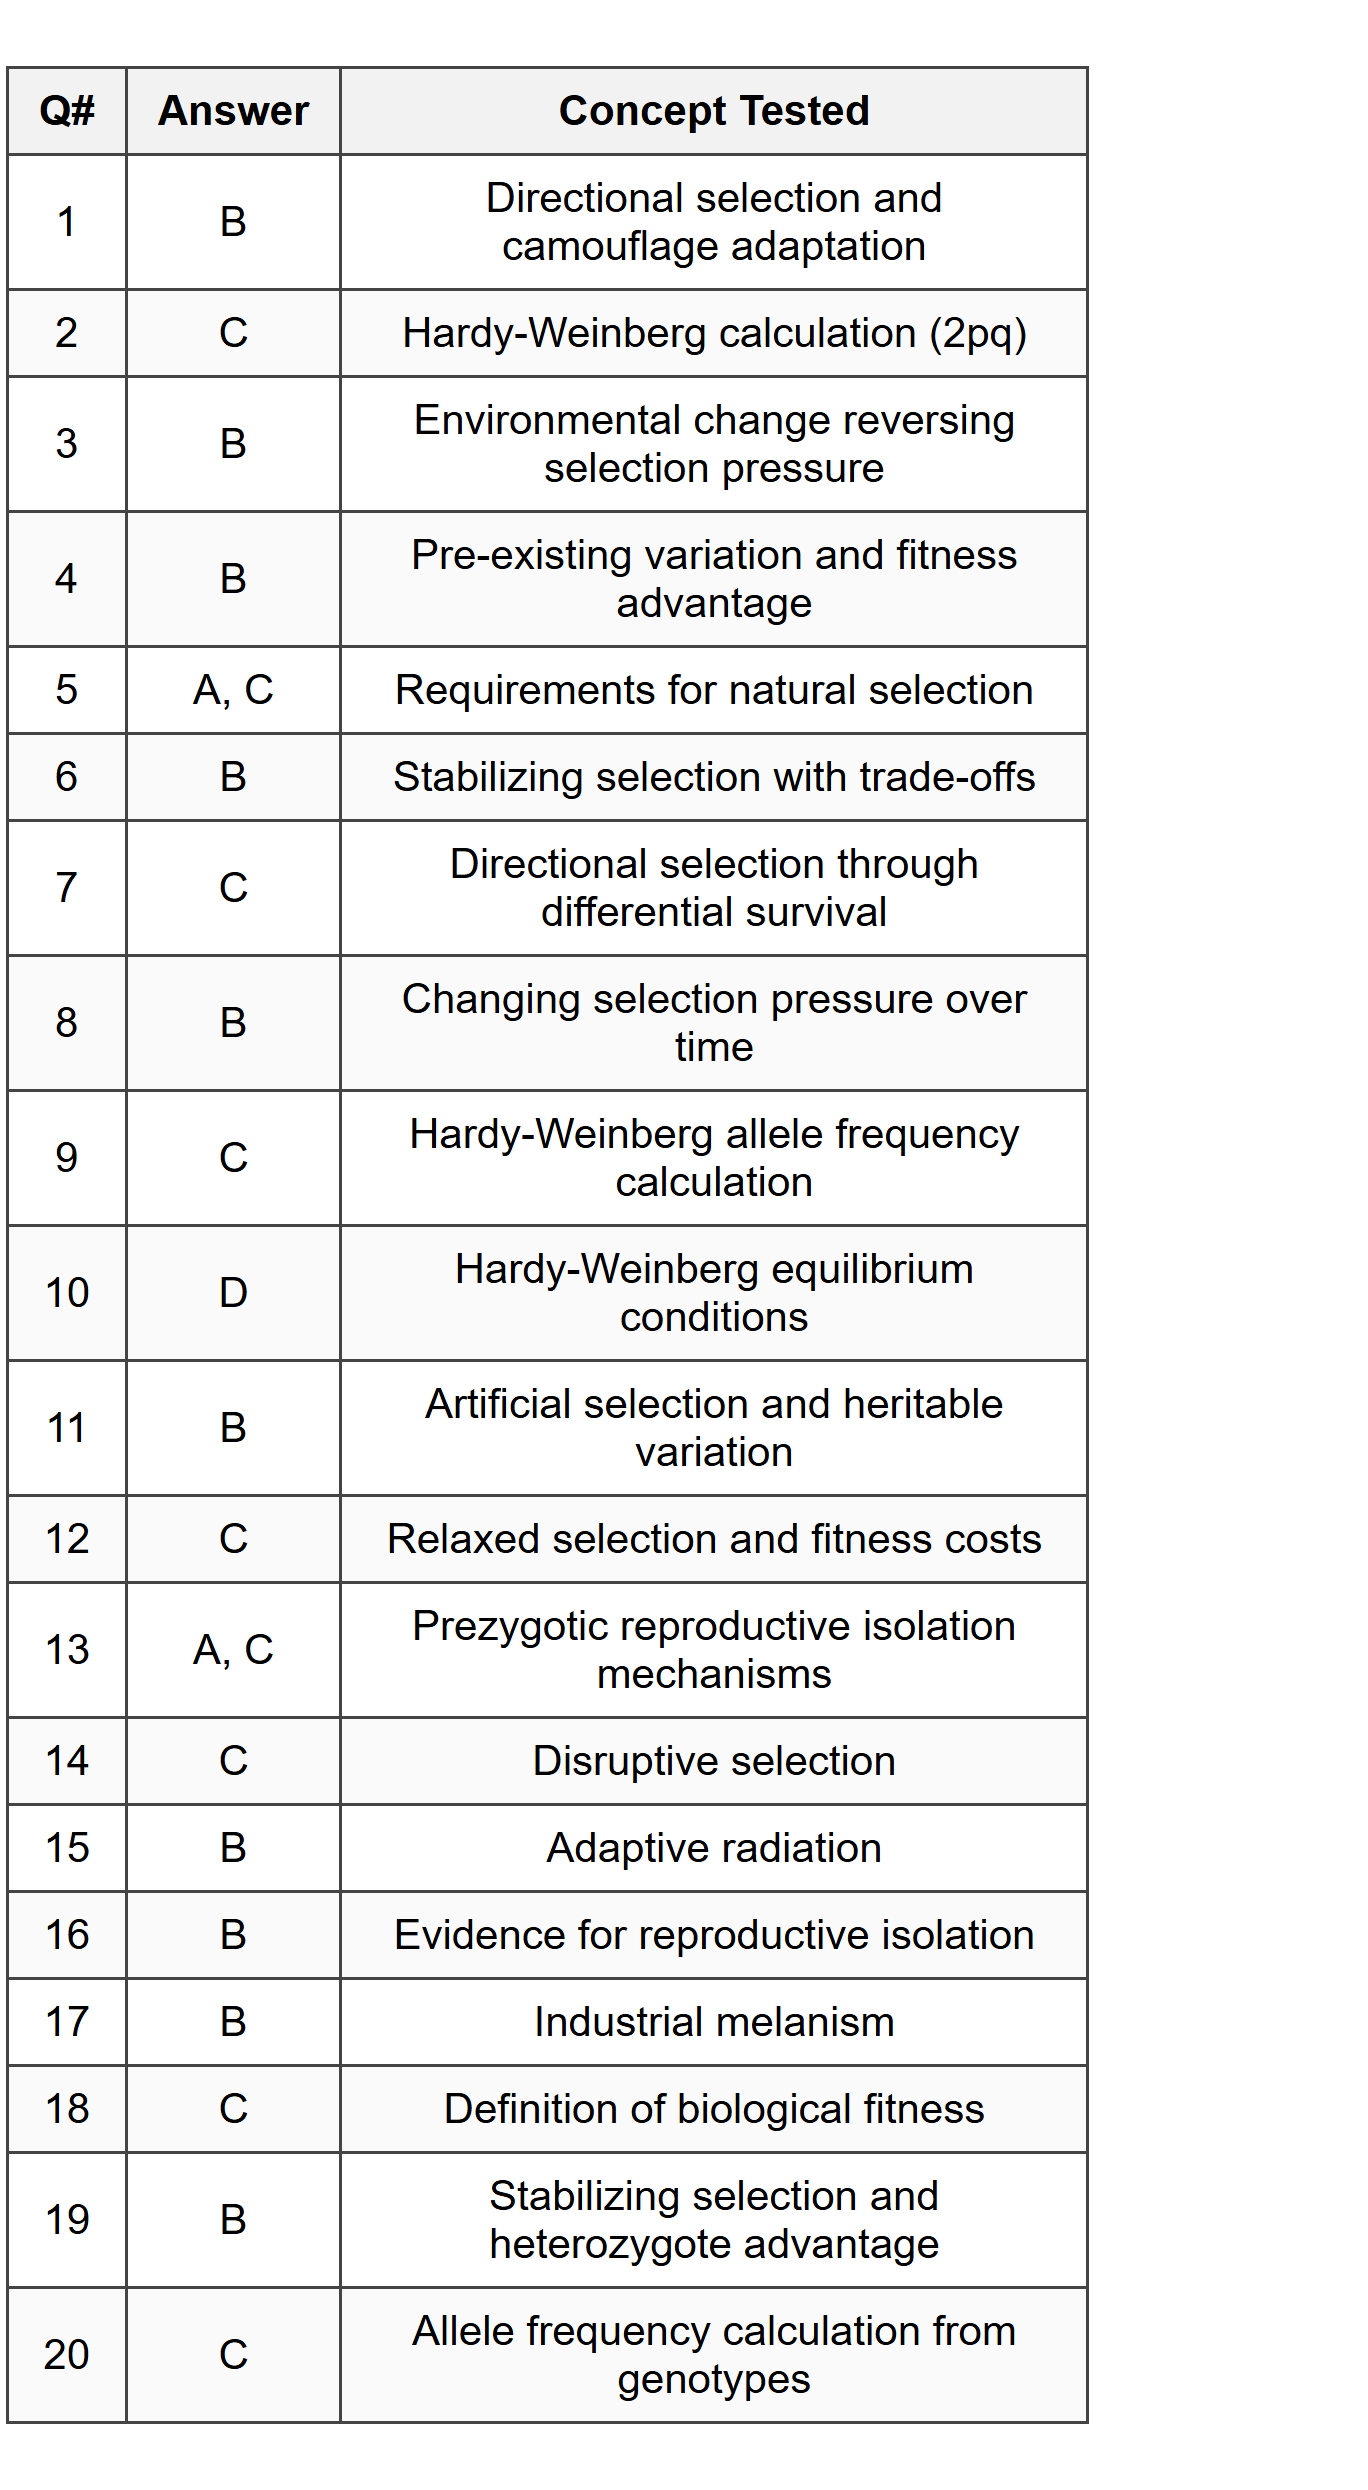
ANSWER KEY
Part A - Multiple Choice Answer Table
Part B - Free Response Answer Key
FRQ 1 - Answer Key
Part A: Experimental procedure
A complete answer must include:
- Independent variable: Beak length (manipulated by selecting finches with different measured beak lengths)
- Dependent variable: Seed-cracking efficiency (measured as number of seeds cracked per unit time, or time required to crack a standardized number of seeds)
- Controlled variables (at least two): seed species and size, seed hardness, individual finch age or mass, hunger level, observation duration, environmental conditions (temperature, lighting)
Sample procedure: Select groups of finches representing a range of beak lengths (e.g., short: 11-12 mm; medium: 13-14 mm; long: 15-16 mm). Provide each bird with the same number of woody cactus seeds of uniform size under standardized conditions. Measure and record the time required for each bird to successfully crack 10 seeds, or count the number of seeds cracked in a fixed 5-minute period. Control for bird age, mass, and prior feeding time to ensure hunger level is similar. Repeat trials multiple times per bird to account for variability. Compare mean seed-cracking performance across beak length groups.
Part B: Calculate observed frequency of the AL allele
Total individuals = 180
ALAL = 81 individuals → 81 × 2 = 162 AL alleles
ALAS = 72 individuals → 72 × 1 = 72 AL alleles
ASAS = 27 individuals → 27 × 0 = 0 AL alleles
Total AL alleles = 162 + 72 = 234
Total alleles in population = 180 × 2 = 360
Frequency of AL = \( \frac{234}{360} = 0.65 \)
Answer: The observed frequency of the AL allele is 0.65.
Part C: Calculate expected number of heterozygotes under Hardy-Weinberg equilibrium
From Part B: frequency of AL (p) = 0.65
Frequency of AS (q) = 1 - 0.65 = 0.35
Expected frequency of ALAS heterozygotes = \( 2pq \)
\( 2pq = 2 × 0.65 × 0.35 = 0.455 \)
Expected number of heterozygotes = \( 0.455 × 180 = 81.9 \) individuals
Answer: The expected number of ALAS individuals is approximately 82.
Part D: Is the population in Hardy-Weinberg equilibrium?
The calculated chi-square value is \( \chi^2 = 2.14 \). The critical value at \( p = 0.05 \) with 1 degree of freedom is 3.84. Since 2.14 < 3.84, we fail to reject the null hypothesis.
Answer: Yes, the population appears to be in Hardy-Weinberg equilibrium. The chi-square value (2.14) is less than the critical value (3.84), meaning the observed genotype frequencies do not differ significantly from the expected frequencies. This suggests that, at least at the time of sampling post-drought, random mating occurred and no detectable evolutionary forces (mutation, migration, drift, or selection) were acting on this locus, or their effects were not statistically significant with this sample size.
Part E: Explain how the data support the hypothesis of natural selection
The data support natural selection through multiple lines of evidence:
- Phenotypic change: Mean beak length increased from 13.2 mm to 14.1 mm between pre-drought and post-drought, a shift of 0.9 mm. This directional change indicates differential survival favoring individuals with longer beaks.
- Population decline: Population size decreased from 280 to 180 individuals, indicating mortality. If survival was random, we would not expect a consistent phenotypic shift.
- Reduced variation: Standard deviation decreased from 1.8 mm to 1.5 mm, suggesting selection removed individuals at the lower end of the beak length distribution.
- Mechanism: The drought reduced availability of small flowers but not large, woody seeds. Longer beaks provide greater mechanical advantage for cracking hard seeds, conferring higher survival (and thus higher fitness) to individuals with the AL allele.
Together, these data show that the environment imposed a selection pressure, heritable variation existed in the population, and individuals with traits better suited to the new conditions had higher survival rates-the classic signature of natural selection.
Part F: Predict the outcome if conditions return to pre-drought levels
Prediction: Mean beak length would likely decrease over subsequent generations, shifting back toward shorter beaks.
Justification: If small cactus flowers become abundant again, finches with shorter beaks may gain a fitness advantage because they can feed more efficiently on small, delicate flowers without the energetic cost of maintaining larger beak structures. Additionally, if longer beaks incur a cost (e.g., greater developmental energy, reduced maneuverability), selection would favor individuals with beaks optimized for the now-available food resources. However, the population would not instantly return to 13.2 mm; the rate and extent of change depend on the strength of selection, generation time, and heritability of the trait. This demonstrates that natural selection is not a one-way process-it is dynamic and responsive to changing environmental conditions.
FRQ 2 - Answer Key
Part A: Identify the mechanism of evolution
Answer: The mechanism of evolution responsible is natural selection.
Part B: Explain the increase in mutation frequency
The mutation in the rpoB gene increased in frequency because it conferred resistance to rifampicin, providing a significant fitness advantage in the presence of the antibiotic. Rifampicin targets RNA polymerase, inhibiting transcription and killing bacteria with the wild-type rpoB gene. However, the mutation alters the structure of RNA polymerase in a way that prevents rifampicin binding while still allowing the enzyme to function.
In the presence of rifampicin, bacteria without the mutation die or cannot reproduce, while mutant bacteria survive and continue dividing. This represents differential reproductive success-the resistant bacteria produce more offspring than susceptible bacteria under antibiotic treatment. Over multiple generations (which occur rapidly in bacteria), the frequency of the resistance allele increases until the population is dominated by resistant bacteria. This is a clear example of natural selection favoring a pre-existing genetic variant in response to an environmental pressure (the antibiotic).
Part C: Describe a practice to reduce spread of resistance
Answer: One effective practice is antibiotic stewardship, which includes prescribing antibiotics only when necessary, using narrow-spectrum antibiotics when possible instead of broad-spectrum drugs, and ensuring patients complete the full course of treatment. This reduces selective pressure that favors resistance and decreases the overall prevalence of resistant bacteria.
Additional acceptable answers include: isolating patients with resistant infections to prevent transmission via contact; rigorous hand hygiene and use of personal protective equipment by healthcare workers; environmental disinfection of patient rooms and equipment; surveillance and monitoring of resistance patterns; using combination therapies to reduce the likelihood that resistance mutations will succeed.


