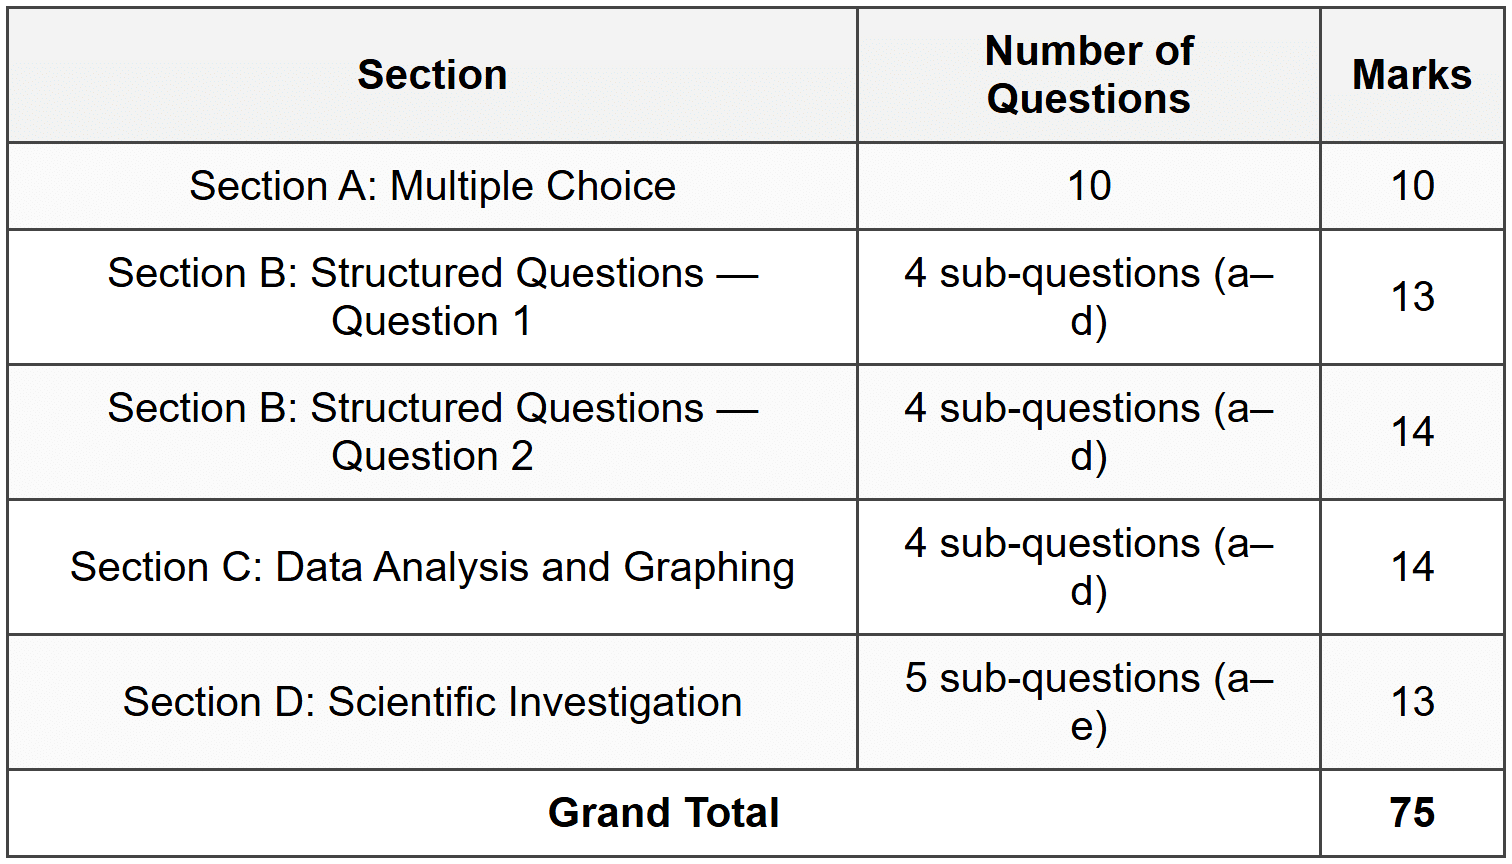
Biosphere to Ecosystems

Section A: Multiple Choice
Choose the correct answer from the options A to D. Write only the letter of the correct answer.
- The biosphere is defined as:
- All the living organisms on Earth only
- The part of Earth where life exists, including land, water, and air
- Only the soil and rock layer of Earth
- The atmosphere surrounding Earth
- Which of the following represents the correct hierarchical sequence from smallest to largest?
- Organism → Population → Community → Ecosystem → Biome → Biosphere
- Organism → Community → Population → Biome → Ecosystem → Biosphere
- Population → Organism → Community → Ecosystem → Biosphere → Biome
- Organism → Ecosystem → Population → Community → Biome → Biosphere
- A population is best described as:
- All the different species living in the same area
- All the members of one species living in the same area at the same time
- All the living and non-living components in an area
- The role an organism plays in its environment
- Thandi collected data from a grassland ecosystem and identified 45 individual impala, 12 zebras, 8 wildebeest, and 3 lions. How many populations did she identify?
- 1
- 4
- 68
- Cannot be determined from the information given
- Which of the following is an abiotic component of an ecosystem?
- Grass
- Soil minerals
- Bacteria
- Fungi
- In a forest ecosystem, Sipho counted 120 trees of the same species in an area of 600 m². What is the population density of these trees?
- 0.2 trees per m²
- 5 trees per m²
- 720 trees per m²
- 72 000 trees per m²
- A biome is characterized by:
- A single species and its habitat
- Only the climate of a region
- Distinct climate, vegetation, and animal life adapted to that environment
- The physical location on Earth only
- Lerato studied a pond and identified all the fish, frogs, water plants, insects, and bacteria living there. This group of organisms is best described as a:
- Population
- Community
- Biome
- Habitat
- If a savanna ecosystem covers an area of 2400 km² and contains an estimated 9600 elephants, what is the population density of elephants in this ecosystem?
- 0.25 elephants per km²
- 4 elephants per km²
- 23 040 000 elephants per km²
- 7200 elephants per km²
- The main difference between a community and an ecosystem is that an ecosystem includes:
- Only plants
- Both biotic and abiotic factors
- Only one species
- Only animals
Section B: Structured Questions
Question 1: Levels of Organization in the Biosphere
Kagiso is investigating a wetland area near his school. He observes the following: reeds growing along the water's edge, 35 red-winged starlings nesting in the reeds, 18 purple herons feeding in the shallow water, water lilies floating on the surface, microscopic algae in the water, dragonfly larvae, frogs, water snakes, mud containing decomposing plant matter, and the water itself with a temperature of 22°C and a pH of 7.2.
- Identify and list three abiotic components that Kagiso observed in the wetland ecosystem. (3)
- Distinguish between the terms population and community using examples from Kagiso's observations. (4)
- Calculate the total number of populations of birds that Kagiso identified in the wetland. Show your reasoning. (2)
- Kagiso wants to compare this wetland to a desert ecosystem. Explain how the concept of a biome helps scientists classify and compare these two very different environments, even though both are part of the same biosphere. (4)
Question 2: Population Density and Distribution
Amahle conducted a field study in a coastal forest reserve. She marked out three separate study plots, each 50 m × 50 m. In Plot A, she counted 80 wild banana plants. In Plot B, she counted 45 wild banana plants. In Plot C, she counted 100 wild banana plants. She also observed that the plants in Plot C were clustered near a stream running through that plot, while plants in Plot A were more evenly spread out.
- Define the term population density. (2)
- Calculate the population density of wild banana plants in Plot C. Express your answer in plants per m². Show all working including the formula, substitution, and final answer with the correct unit. (4)
- Calculate the average population density of wild banana plants across all three plots combined. Show all working. (4)
- Amahle noticed that the population density was highest in Plot C where a stream was present. Evaluate why the presence of water would affect the distribution and density of plant populations in this ecosystem, referring to both biotic and abiotic factors in your answer. (4)
Section C: Data Analysis and Graphing
Question: Population Sizes Across Ecosystem Levels
Bongani investigated a section of the Kruger National Park ecosystem. He collected data on various organisms within a defined area of 10 km². His findings are summarized in the table below:
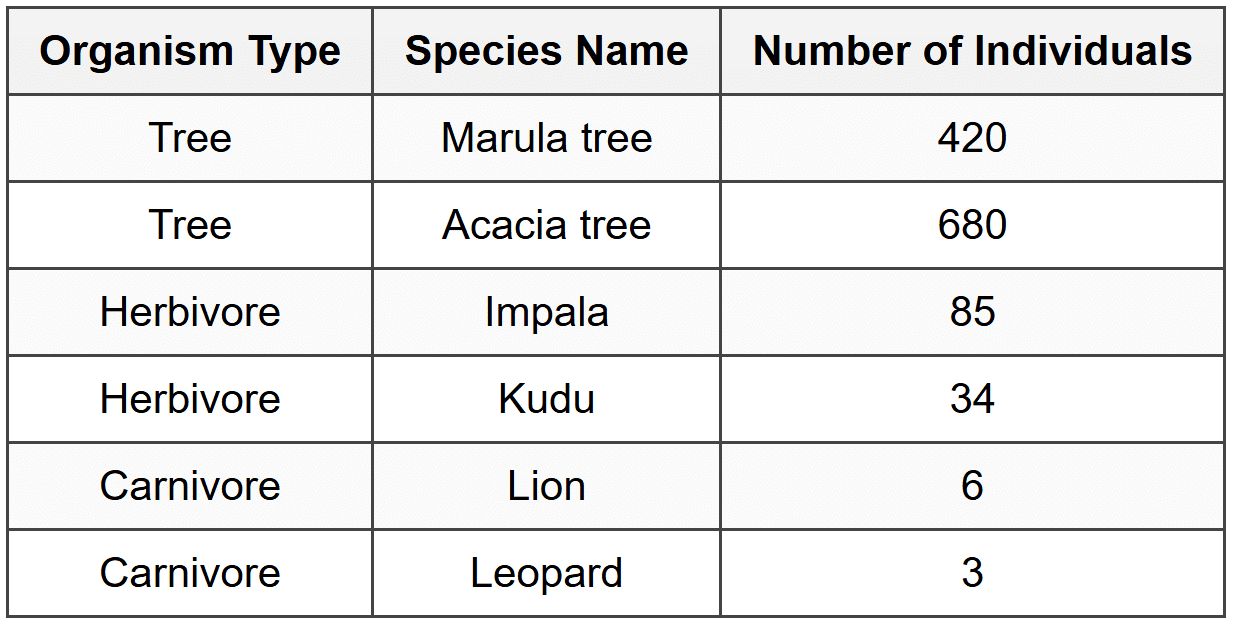
- How many different populations did Bongani identify in his study area? (1)
- Calculate the total population density of all tree species combined in this ecosystem. Express your answer in trees per km². Show the formula, substitution, and all working. (4)
- Calculate the population density of carnivores (lions and leopards combined) in this area. Express your answer in individuals per km². Show all working. (4)
- Analyze the data in the table and explain the pattern you observe in the population sizes moving from trees to herbivores to carnivores. In your answer, explain why this pattern is typical of ecosystems and what would happen to the carnivore populations if the herbivore populations decreased significantly. (5)
Section D: Scientific Investigation
Question: Investigating the Effect of Area Size on Species Diversity
Zanele and Mpho wanted to investigate whether the size of a habitat area affects the number of different plant species (species diversity) found within it. They hypothesized that larger areas would contain more plant species than smaller areas. They selected a grassland biome and marked out five square plots of different sizes: 1 m², 4 m², 9 m², 16 m², and 25 m². Each plot was located in similar environmental conditions (same soil type, same slope, same amount of sunlight). In each plot, they carefully identified and counted the number of different plant species present. Their results are shown below:
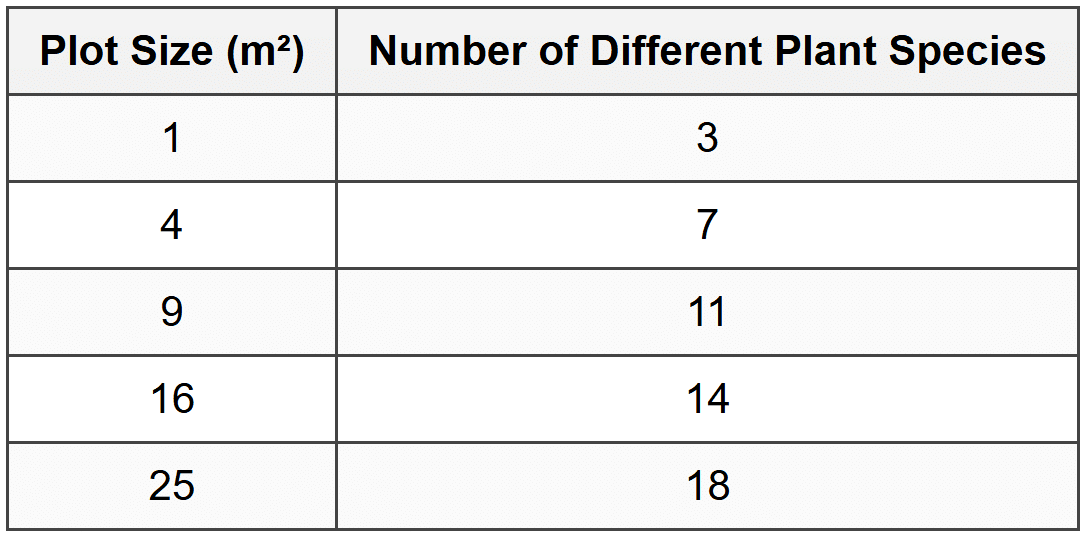
- Identify the independent variable in this investigation. (1)
- Identify the dependent variable in this investigation. (1)
- Name one controlled variable in this investigation and explain why it was necessary to keep this variable constant. (3)
- Write a hypothesis for this investigation using the format: If [condition], then [expected result], because [scientific reason]. (3)
- Based on the results in the table, state whether the hypothesis was supported or not supported. Justify your conclusion by referring to specific data from the table and explain the ecological reason why this relationship exists between habitat area and species diversity in ecosystems. (5)
Grand Total: [75]
Answer Key
Well done for completing the worksheet! Before you check your answers, make sure you have attempted every question to the best of your ability. Use this answer key to mark your work carefully, and take note of where you can improve. Remember, understanding why an answer is correct is more important than just getting the right answer. Good luck!
Section A - Multiple Choice
Section A - Question 1
B - The part of Earth where life exists, including land, water, and air
The biosphere is not just living organisms alone, but includes all the regions of Earth where life can be found: the lithosphere (land), hydrosphere (water), and atmosphere (air). This option captures the full definition of the biosphere as the zone of life.
Section A - Question 2
A - Organism → Population → Community → Ecosystem → Biome → Biosphere
This sequence correctly shows the organizational levels from the smallest (individual organism) to the largest (biosphere). Each level includes all the components of the previous level plus additional complexity, which is the key to understanding ecological organization.
Section A - Question 3
B - All the members of one species living in the same area at the same time
A population is defined specifically as individuals of the same species in a defined area at a specific time. The other options describe community, ecosystem, or niche, not population.
Section A - Question 4
B - 4
Each different species represents a separate population. Thandi identified impala, zebras, wildebeest, and lions - four different species, therefore four populations. The total number of individuals (68) is not the number of populations.
Section A - Question 5
B - Soil minerals
Abiotic components are non-living physical and chemical factors. Soil minerals are non-living, while grass, bacteria, and fungi are all living (biotic) components.
Section A - Question 6
A - 0.2 trees per m²
Calculation:
Population density = Number of individuals ÷ Area
= 120 trees ÷ 600 m²
= 0.2 trees·m⁻²
Section A - Question 7
C - Distinct climate, vegetation, and animal life adapted to that environment
A biome is a large geographical region characterized by specific climate conditions and the particular plants and animals adapted to those conditions. All three factors work together to define a biome, not just one factor alone.
Section A - Question 8
B - Community
A community consists of all the different populations (different species) living together in the same area. Lerato identified multiple species (fish, frogs, plants, insects, bacteria), which together form a community, not just a single population.
Section A - Question 9
B - 4 elephants per km²
Calculation:
Population density = Number of individuals ÷ Area
= 9600 elephants ÷ 2400 km²
= 4 elephants·km⁻²
Section A - Question 10
B - Both biotic and abiotic factors
A community includes only the living organisms (biotic factors), while an ecosystem includes both the living organisms and the non-living physical and chemical environment (abiotic factors) with which they interact.
Section B - Structured Questions
Section B - Question 1(a)
Any three of the following abiotic components:
- Water
- Mud/soil
- Temperature (22°C)
- pH (7.2)
- Sunlight (implied for photosynthesis)
Section B - Question 1(b)
A population is all the individuals of one species living in the same area at the same time. For example, the 35 red-winged starlings form one population, and the 18 purple herons form another population.
A community is all the different populations (all the different species) living together in the same area. For example, the reeds, starlings, herons, water lilies, algae, dragonfly larvae, frogs, and water snakes together form the wetland community.
(Award 2 marks for correct definition of population with example, 2 marks for correct definition of community with example)
Section B - Question 1(c)
Kagiso identified 2 populations of birds.
The two bird species mentioned are red-winged starlings and purple herons. Each species represents a separate population, so there are 2 bird populations.
(Award 1 mark for correct answer of 2, and 1 mark for clear reasoning)
Section B - Question 1(d)
A biome is a large geographical area characterized by specific climate conditions and distinct types of plants and animals adapted to those conditions. Biomes allow scientists to classify ecosystems into broad categories based on shared characteristics such as temperature, rainfall, and dominant vegetation.
The wetland and desert are both ecosystems within the biosphere, but they belong to different biomes because they have very different climates (wetlands are wet with high water availability; deserts are dry with very low rainfall) and very different organisms adapted to those conditions. Using the biome concept helps scientists understand that while both are part of the same biosphere, they function very differently and support different communities of life.
(Award 2 marks for explaining what a biome is, and 2 marks for explaining how it helps compare the wetland and desert ecosystems)
Section B - Question 2(a)
Population density is the number of individuals of a species per unit area (or per unit volume).
(Award 1 mark for "number of individuals" and 1 mark for "per unit area")
Section B - Question 2(b)
Formula:
Population density = Number of individuals ÷ Area
Given values:
Number of wild banana plants in Plot C = 100
Area of Plot C = 50 m × 50 m = 2500 m²
Substitution:
Population density = 100 plants ÷ 2500 m²
= 0.04 plants·m⁻²
Final answer: 0.04 plants·m⁻²
(Award 1 mark for correct formula, 1 mark for correct area calculation, 1 mark for correct substitution and working, 1 mark for correct final answer with unit)
Section B - Question 2(c)
Step 1: Calculate total number of plants in all three plots
Total plants = 80 + 45 + 100 = 225 plants
Step 2: Calculate total area of all three plots
Each plot area = 50 m × 50 m = 2500 m²
Total area = 3 × 2500 m² = 7500 m²
Step 3: Calculate average population density
Average population density = Total plants ÷ Total area
= 225 plants ÷ 7500 m²
= 0.03 plants·m⁻²
Final answer: 0.03 plants·m⁻²
(Award 1 mark for total plants, 1 mark for total area, 1 mark for correct calculation, 1 mark for correct final answer with unit)
Section B - Question 2(d)
The presence of water is a critical abiotic factor that directly affects plant population density and distribution. Plants require water for photosynthesis, nutrient transport, and cell processes, so areas near water sources support higher densities of plants.
In Plot C, the stream provides a reliable water supply, which allows more wild banana plants to survive and grow, leading to higher population density. The clustering near the stream shows that plants are distributed where this essential abiotic resource is available.
Additionally, the higher plant density in Plot C creates more biotic interactions - more plants mean more competition for light and nutrients, but also more organic matter in the soil from decomposing plant material. The abiotic factor (water availability) therefore shapes the biotic community structure.
(Award 2 marks for explaining water as the key abiotic factor affecting density, 1 mark for linking to plant survival needs, 1 mark for explaining the biotic consequence or interaction. Full marks require mention of both abiotic and biotic factors.)
Section C - Data Analysis and Graphing
Section C - Question (a)
6 populations
Each species represents a separate population: Marula tree, Acacia tree, Impala, Kudu, Lion, Leopard = 6 populations.
(Award 1 mark for correct answer)
Section C - Question (b)
Formula:
Population density = Number of individuals ÷ Area
Given values:
Total number of trees = 420 (Marula) + 680 (Acacia) = 1100 trees
Area = 10 km²
Substitution:
Population density = 1100 trees ÷ 10 km²
= 110 trees·km⁻²
Final answer: 110 trees·km⁻²
(Award 1 mark for correct formula, 1 mark for correctly adding tree species, 1 mark for correct substitution, 1 mark for final answer with correct unit)
Section C - Question (c)
Formula:
Population density = Number of individuals ÷ Area
Given values:
Total number of carnivores = 6 (lions) + 3 (leopards) = 9 carnivores
Area = 10 km²
Substitution:
Population density = 9 carnivores ÷ 10 km²
= 0.9 carnivores·km⁻² (or individuals·km⁻²)
Final answer: 0.9 individuals·km⁻²
(Award 1 mark for correct formula, 1 mark for correctly adding carnivore species, 1 mark for correct substitution, 1 mark for final answer with correct unit)
Section C - Question (d)
The data shows a clear pattern: population sizes decrease as you move from trees (1100 individuals) to herbivores (119 individuals) to carnivores (9 individuals).
This pattern is typical of ecosystems because it reflects energy transfer through feeding relationships. Trees (producers) are most numerous because they capture energy from the sun through photosynthesis. Herbivores that feed on trees are fewer in number because energy is lost as heat and used for life processes when transferred from one level to the next. Carnivores that feed on herbivores are even fewer because they receive only a small fraction of the original energy captured by plants.
If herbivore populations decreased significantly, the carnivore populations would also decrease because carnivores depend on herbivores as their food source. With less food available, fewer carnivores would be able to survive and reproduce. This demonstrates the interdependence of populations within an ecosystem - changes in one population affect other populations.
Some carnivores might also starve or be forced to migrate to other areas to find food.
For full marks (5): Student must (1) identify the decreasing pattern with reference to data, (2) explain that this is due to energy loss between levels, (3) state that carnivore populations would decrease if herbivores decrease, (4) explain the dependence relationship, (5) mention a consequence such as starvation or migration.
For partial marks (3-4): Student identifies pattern and gives basic explanation of food dependence but does not explain energy loss or consequences in detail.
For partial marks (1-2): Student only identifies the pattern or only states carnivores would decrease without scientific explanation.
Section D - Scientific Investigation
Section D - Question (a)
Independent variable: Plot size (or area of the plot measured in m²)
This is the independent variable because it is the factor that Zanele and Mpho deliberately changed in the investigation to see its effect on species diversity.
(Award 1 mark for correct identification)
Section D - Question (b)
Dependent variable: Number of different plant species (or species diversity)
This is the dependent variable because it is the factor that is measured in response to changes in the plot size. Its value depends on the independent variable.
(Award 1 mark for correct identification)
Section D - Question (c)
Any one of the following controlled variables:
- Soil type - must be kept constant because different soil types have different nutrient levels and pH, which would affect which plant species can grow, making it impossible to tell if differences in species number are due to plot size or soil type.
- Slope - must be kept constant because slope affects water drainage and sunlight exposure, which would independently affect plant species diversity.
- Amount of sunlight - must be kept constant because different light levels favour different plant species, and variation in sunlight would confound the results.
Section D - Question (d)
Model hypothesis:
If the plot size (area) increases, then the number of different plant species will increase, because larger areas provide more microhabitats and resources that can support a greater variety of plant species.
(Award 1 mark for correct "If" condition, 1 mark for correct "then" expected result, 1 mark for scientifically valid "because" reasoning)
Section D - Question (e)
Conclusion:
The hypothesis is supported by the results.
The data in the table shows that as the plot size increased from 1 m² to 25 m², the number of different plant species also increased from 3 species to 18 species. Every increase in plot size resulted in an increase in the number of species recorded, with no exceptions.
The ecological reason for this relationship is that larger habitat areas contain more diverse microhabitats and environmental conditions (such as variation in moisture, light, and soil nutrients), which allows a wider variety of plant species to find suitable niches and coexist. Larger areas also support larger populations, which reduces the risk of local extinction, thereby maintaining higher species diversity.
Additionally, smaller areas may only support a few dominant species that outcompete others, whereas larger areas have enough space for many species to coexist with less intense competition.
For full marks (5): Student must (1) clearly state hypothesis is supported, (2) reference specific data from the table, (3) explain the positive relationship between area and diversity, (4) provide ecological reasoning involving microhabitats/niches or population size, (5) make a further point about competition or extinction risk.
For partial marks (3-4): Student states hypothesis is supported with data reference and gives basic ecological explanation but lacks depth or additional reasoning.
For partial marks (1-2): Student only states hypothesis is supported with limited or no data reference and no clear ecological explanation.
Mark Allocation Summary